עדכון 4 בדצמבר 2025. כבר הכנתי את גרסת התוסף, ואשלח אותה למאגר של WordPress כשתהיה מוכנה. כשתהיה מוכנה להורדה, אעדכן את ההודעה הזו.
לפני יותר משנתיים הפסקתי להשתמש ב-Google Analytics ועברתי ל-Matomo On-Premise (באירוח עצמי). ואני מאוד מרוצה.
אם אתה משתמש ב-Matomo On-Premise, אתה כבר יודע שמדובר בכלי חזק ומקיף, אך הצורך לפתוח כרטיסייה חדשה בכל פעם שאתה רוצה לראות את הנתונים הסטטיסטיים הבסיסיים הוא לא נוח ואף עלול להיות תובעני מדי עבור השרת שלך, למרות שהביצועים שלו השתפרו מאוד מאז תחילת דרכו, כאשר נקרא Piwic, ואכל את השרת בבת אחת על בסיס בקשות.
ישנם תוספים לשילוב Matomo, אך הם נוטים לסבול משתי בעיות: הם מציגים iframes שנחסמים מטעמי אבטחה, או מבצעים בקשות PHP סינכרוניות שמאטות את לוח הניהול.
ווידג'ט המשתמש ב-API של Matomo
החלטתי ליצור ווידג'ט מקורי לשולחן העבודה של WordPress באמצעות ה-API של Matomo, שיהיה קל, אסתטי ובעיקר בזמן אמת, אך ללא השפעה על השרת, ושהכל יפעל בדפדפן של הלקוח. לשם כך הסתייעתי בתיעוד של Matomo ובעזרת Gemini 3.0, ששיפרה מאוד את הגרסה החדשה שלה בכל הקשור לטיפול בקוד, וגם כי אני לא יודע לכתוב יותר משלוש שורות בלי לשבור משהו.
אזהרה: הווידג'ט מיועד להתקנות On-Premise (אותו שרת או שרת משלך), אך מכיוון שהוא JS, הוא יעבוד גם אם יש לך Matomo בדומיין אחר, כל עוד CORS (הרשאות הדפדפן) מאפשר זאת.
לאחר ההסבר על תפקידיו וכיצד להוסיף אותו, תמצא את הקוד המלא רק כדי שתוכל להוסיף אותו ל-functions.php של התבנית שלך, ערכת העיצוב הבת או עם תוסף הסניפטים שלך, ולכלול בו את כתובת ה-URL שלך, מזהה הפרויקט שלך ואסימון האישור של Matomo.
נתונים בסיסיים בזמן אמת
מכיוון שאני לא צריך הרבה מדדים בווידג'ט, הגדרתי אותו עם שלושת התיבות הבסיסיות שאני בודק באופן שגרתי.
הראשון הוא מונה המבקרים המחוברים, המתעדכן אוטומטית כל עשר שניות.
מתחת מוצגות שתי תיבות, עם המספר הכולל של הביקורים ביום, ומימין להן "פעולות", גם הן מהיום, שלמרות שמאטומי מכנה אותן "הופעות", זה לא מדויק לחלוטין, כי הן כוללות גם פעולות אחרות כמו פתיחת תמונה, ביצוע חיפוש, הפעלת אירוע בלחיצה או לחיצה על קישור לכתובת URL חיצונית. שני התיבות מתבססות על נתונים היסטוריים של 30 יום בתוספת הזנת נתונים בזמן אמת.

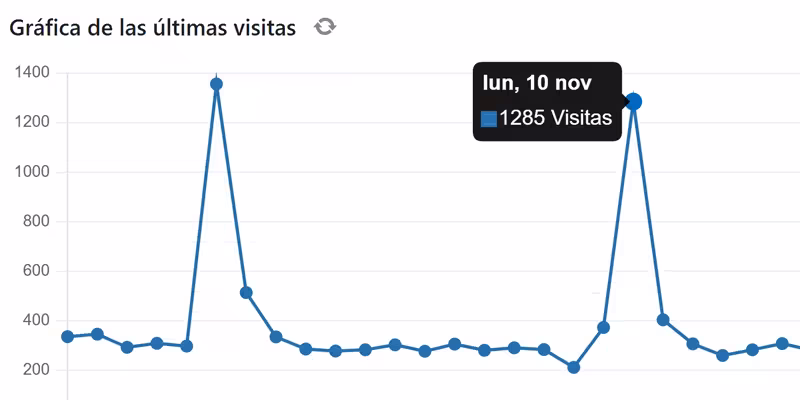
גרף הביקורים הוא התיבה היחידה שאינה מתעדכנת בזמן אמת, מכיוון שאין טעם לכפות בקשות מיותרות עבור נתון שכבר קיים בתיבה "ביקורים (היום)", ולכן נוסף כפתור עדכון כדי לרענן את הגרף בכל עת בלחיצה אחת. מתחת יש קישור להורדת קובץ CSV או תמונה של הגרף של 30 הימים האחרונים.
לגרף זה נעשה שימוש בספריית Chart.js, המאפשרת לצייר אותו במקום להשתמש בתמונה סטטית, ובכך מאפשרת אינטראקציה וצפייה בנתונים לפי יום בנקודות.

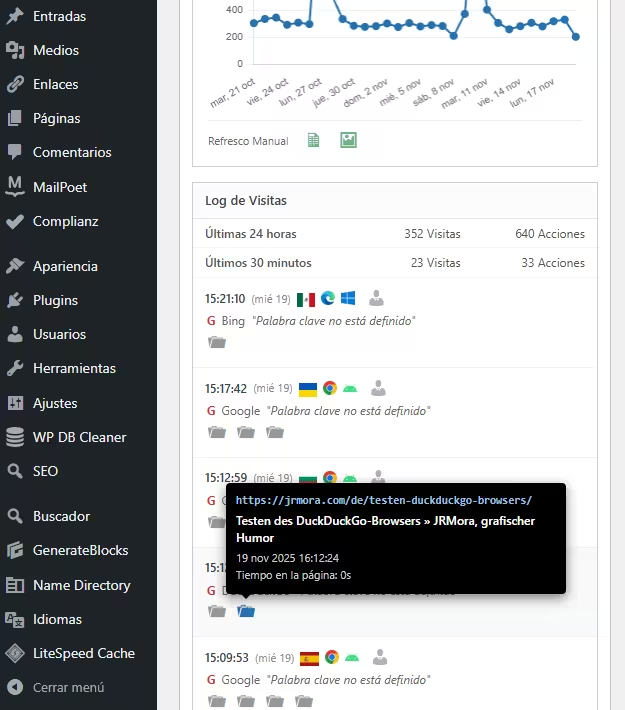
התיבה הרביעית היא יומן מפורט של ביקורים המציג: דגלים, דפדפנים, מערכות הפעלה וקישור לדוח המקורי של פרופיל המבקר. כל הפעולות מוצגות באופן חזותי עם הסמלים המתאימים לביקורים, הורדות (של תמונות או קבצי PDF או כל דבר אחר), לחיצות על קישורים חיצוניים, חיפושים פנימיים באתר ואירועים.

לסמלים יש תיאורי כלים " עשירים" בצורת תיבות שחורות המחקות את הסגנון המקורי של Matomo עם כל המידע הרלוונטי המינימלי.

צעדים שיש לנקוט
1. קבל את האסימון שלך מ-Matomo
אתה צריך "מפתח" כדי ש-WordPress שלך יוכל "לתקשר" עם Matomo שלך:
- היכנס ל-Matomo שלך.
- עבור אל ניהול (גלגל שיניים) > צוות > אבטחה.
- צור אסימון אימות חדש. העתק את מחרוזת התווים הזו. רשום אותה מיד ושמור אותה, כי היא תוצג בפניך רק פעם אחת, ואם תאבד אותה, תצטרך ליצור אסימון חדש.
עליך לוודא ששתי התיבות המופיעות אינן מסומנות. אם הן מסומנות, הסר את הסימון כדי שיופיעו כפי שמוצג בתמונה:

2. הגדרות
לאחר הוספת הקוד לקובץ functions.php, עליך לערוך את שלוש השורות הבאות ב- // --- CONFIGURACIÓN --- כדי להוסיף את הנתונים שלך:
$matomo_url  = 'https://tu-dominio.com/matomo/'; // La URL donde tienes instalado Matomo
$id_site     = '1'; // El ID de tu sitio (suele ser 1)
$token_auth  = 'PEGA_AQUI_TU_TOKEN_DE_32_CARACTERES';
3. קוד
עדכון 22/11/2025. גרסה 27 עם מדדי מגמות בתיבות "ביקורים" ו"פעולות".

עדכון 28/11/2025. גרסה 45. נוספה גרף עם ממוצע התשואה היומי. עם תיאור מפורט וסיכום עם כפתור רענון (30 הימים האחרונים).

/**
* Widget Matomo V45 - Fix Refresco Gráfica Rendimiento (Inyección "Hoy")
*/
if ( ! function_exists( 'jrmora_setup_matomo_v45' ) ) {
// 1. REGISTRO
function jrmora_setup_matomo_v45() {
wp_add_dashboard_widget(
'jrmora_matomo_widget_v45',
'Estadísticas Matomo (En Vivo)',
'jrmora_render_matomo_v45'
);
}
add_action( 'wp_dashboard_setup', 'jrmora_setup_matomo_v45' );
// 2. RENDERIZADO
function jrmora_render_matomo_v45() {
// --- CONFIGURACIÓN ---
$matomo_url = 'https://tudominio/matomo/';
$id_site = '1';
$token_auth = 'PON_AQUI_TU_TOKEN_REAL'; // <--- TU TOKEN
// ---------------------
$export_csv = $matomo_url . "index.php?module=API&method=VisitsSummary.get&idSite=$id_site&period=day&date=last30&format=CSV&token_auth=$token_auth";
$export_img = $matomo_url . "index.php?module=API&method=ImageGraph.get&idSite=$id_site&apiModule=VisitsSummary&apiAction=get&token_auth=$token_auth&graphType=evolution&period=day&date=last30&width=800&height=400";
?>
<script src="https://cdn.jsdelivr.net/npm/chart.js"></script>
<style>
.matomo-js-wrapper { font-family: -apple-system, BlinkMacSystemFont, "Segoe UI", Roboto, sans-serif; position: relative; min-height: 250px; }
.status-bar { text-align: right; font-size: 11px; color: #888; margin-bottom: 10px; margin-top: -30px; }
.loading-dot { display: inline-block; width: 8px; height: 8px; background-color: #ccc; border-radius: 50%; margin-right: 5px; transition: background 0.3s; }
.loading-dot.active { background-color: #2271b1; box-shadow: 0 0 5px #2271b1; }
/* HERO & KPI */
.hero-box { background: #fff; border: 1px solid #ccd0d4; border-left: 4px solid #2271b1; padding: 20px; text-align: center; margin-bottom: 15px; box-shadow: 0 1px 2px rgba(0,0,0,0.05); }
.hero-num { font-size: 64px; font-weight: 700; color: #1d2327; line-height: 1; display: block; margin-bottom: 5px; }
.hero-desc { font-size: 13px; color: #646970; }
.kpi-grid { display: flex; gap: 10px; margin-bottom: 15px; }
.kpi-card { background: #fff; border: 1px solid #ccd0d4; padding: 15px 10px; flex: 1; text-align: center; }
.kpi-card h4 { margin: 0; font-size: 11px; color: #666; text-transform: uppercase; }
.kpi-val-group { display: flex; align-items: baseline; justify-content: center; gap: 8px; margin-top: 5px; }
.kpi-card .val { font-size: 24px; font-weight: 600; color: #333; line-height: 1; }
.trend-badge { font-size: 11px; font-weight: 500; padding: 2px 6px; border-radius: 10px; display: inline-flex; align-items: center; }
.trend-up { color: #00a32a; background: #eaffea; }
.trend-down { color: #d63638; background: #ffebeb; }
.trend-neutral { color: #666; background: #f0f0f1; }
.trend-icon { font-size: 10px; margin-right: 2px; }
/* GRAPHS COMMON */
.graph-container { background: #fff; border: 1px solid #ccd0d4; margin-bottom: 15px; padding: 15px; position: relative; }
.graph-header { display: flex; justify-content: space-between; align-items: center; margin-bottom: 10px; }
.graph-title-area { display: flex; align-items: center; gap: 8px; }
.graph-title { font-size: 14px; font-weight: 600; color: #1d2327; }
.btn-graph-refresh { cursor: pointer; color: #888; font-size: 16px; display: flex; align-items: center; justify-content: center; width: 20px; height: 20px; border-radius: 50%; transition: all 0.3s; }
.btn-graph-refresh:hover { background: #f0f0f1; color: #2271b1; }
.btn-graph-refresh.spinning { animation: spin 1s linear infinite; color: #2271b1; }
@keyframes spin { 100% { transform: rotate(360deg); } }
.chart-canvas-box { position: relative; height: 250px; width: 100%; }
.graph-actions { display: flex; gap: 15px; padding-top: 10px; border-top: 1px solid #eee; margin-top: 5px; justify-content: flex-start; }
.action-icon { text-decoration: none; color: #2e8b57; font-size: 18px; opacity: 0.7; transition: opacity 0.2s; }
.action-icon:hover { opacity: 1; color: #1e7040; }
/* LOG */
.log-container { border: 1px solid #ccd0d4; background: #fff; }
.log-header { background: #fcfcfc; padding: 8px 12px; border-bottom: 1px solid #e5e5e5; font-weight: 600; font-size: 13px; }
.summary-table { width: 100%; font-size: 12px; border-collapse: collapse; border-bottom: 1px solid #eee; }
.summary-table td { padding: 6px 12px; border-bottom: 1px solid #f6f6f6; text-align: right; color: #555; }
.summary-table td:first-child { text-align: left; font-weight: 500; }
.visitor-row { padding: 10px 12px; border-bottom: 1px solid #f0f0f1; font-size: 12px; }
.visitor-row:hover { background: #f8f9fa; }
.v-line { display: flex; align-items: center; gap: 6px; margin-bottom: 4px; position: relative; flex-wrap: wrap; }
.v-icons img { height: 14px; vertical-align: middle; margin-right: 3px; }
.v-ref { color: #666; margin-left: 2px; }
.v-actions { margin-top: 4px; margin-left: 2px; color: #888; display: flex; flex-wrap: wrap; gap: 4px; }
.error-box { color: red; padding: 20px; text-align: center; display: none; }
/* TOOLTIPS & ICONS */
.m-tooltip-box { visibility: hidden; background-color: #000; color: #fff; text-align: left; border-radius: 4px; padding: 10px; position: absolute; z-index: 99999; bottom: 135%; opacity: 0; transition: opacity 0.2s; font-size: 11px; line-height: 1.4; box-shadow: 0 4px 12px rgba(0,0,0,0.5); pointer-events: none; white-space: normal; }
.m-tooltip-box::after { content: ""; position: absolute; top: 100%; left: 20px; margin-left: -5px; border-width: 5px; border-style: solid; border-color: #000 transparent transparent transparent; }
.flag-wrapper { position: relative; display: inline-block; cursor: help; }
.flag-wrapper .m-tooltip-box { width: 280px; left: 50%; margin-left: -20px; }
.flag-wrapper:hover .m-tooltip-box { visibility: visible; opacity: 1; }
.ft-row { display: block; margin-bottom: 2px; }
.ft-label { color: #aaa; font-weight: 400; margin-right: 4px; }
.ft-val { color: #fff; font-weight: 600; }
.action-wrapper { position: relative; display: inline-block; margin-right: 5px; text-decoration: none; }
.action-wrapper .m-tooltip-box { width: 320px; left: -10px; bottom: 140%; }
.action-wrapper:hover .m-tooltip-box { visibility: visible; opacity: 1; }
.at-url { color: #9ec2e6; font-weight: 600; word-break: break-all; margin-bottom: 4px; font-family: monospace; font-size: 11px; }
.at-title { color: #fff; font-weight: 600; margin-bottom: 4px; font-size: 12px; display: block; }
.at-meta { color: #ccc; display: block; margin-bottom: 2px; }
.profile-link { color: #b0b0b0; text-decoration: none; cursor: pointer; margin-left: 2px; }
.profile-link:hover { color: #2271b1; }
.action-wrapper .dashicons { font-size: 18px; color: #999; transition: color 0.2s; }
.action-wrapper:hover .dashicons { color: #2271b1; cursor: pointer; }
.load-time-badge { font-size: 12px; color: #1d2327; background: #fff3c9; padding: 2px 5px; border-radius: 4px; font-weight: 600; margin-left: 10px; line-height: 1; }
</style>
<div class="status-bar"><span class="loading-dot" id="m-dot"></span> <span id="m-status">Conectando...</span></div>
<div class="matomo-js-wrapper">
<div id="m-error" class="error-box"></div>
<div class="hero-box">
<span class="hero-num" id="val-live">--</span>
<div class="hero-desc"><span id="val-live-vis">--</span> visitas y <span id="val-live-act">--</span> acciones (últimos 3 min)</div>
</div>
<div class="kpi-grid">
<div class="kpi-card"><h4>Visitas (Hoy)</h4><div class="kpi-val-group"><span class="val" id="val-uniq">--</span><span class="trend-badge" id="trend-uniq"></span></div></div>
<div class="kpi-card"><h4>Acciones (Hoy)</h4><div class="kpi-val-group"><span class="val" id="val-page">--</span><span class="trend-badge" id="trend-page"></span></div></div>
</div>
<div class="graph-container">
<div class="graph-header">
<div class="graph-title-area">
<span class="graph-title">Gráfica de visitas</span>
<span id="btn-refresh-visits" class="btn-graph-refresh dashicons dashicons-update" title="Actualizar"></span>
</div>
</div>
<div class="chart-canvas-box"><canvas id="matomoChart"></canvas></div>
<div class="graph-actions">
<span style="font-size:11px; color:#666; padding-top:2px;">Últimos 30 días</span>
<a href="<?php echo esc_url($export_csv); ?>" target="_blank" class="action-icon dashicons dashicons-media-spreadsheet" title="CSV"></a>
<a href="<?php echo esc_url($export_img); ?>" target="_blank" class="action-icon dashicons dashicons-format-image" title="Imagen"></a>
</div>
</div>
<div class="graph-container">
<div class="graph-header">
<div class="graph-title-area">
<span class="graph-title">Evolución del Rendimiento (Segundos)</span>
<span id="btn-refresh-perf" class="btn-graph-refresh dashicons dashicons-update" title="Actualizar"></span>
</div>
</div>
<div class="chart-canvas-box"><canvas id="perfChart"></canvas></div>
</div>
<div class="log-container">
<div class="log-header">Log de Visitas</div>
<table class="summary-table">
<tr><td>Últimas 24 horas</td><td id="val-24-v">--</td><td id="val-24-a">--</td></tr>
<tr><td>Últimos 30 minutos</td><td id="val-30-v">--</td><td id="val-30-a">--</td></tr>
</table>
<div class="log-rows" id="log-content">
<div style="padding:20px; text-align:center; color:#ccc;">Cargando...</div>
</div>
</div>
</div>
<script>
(function() {
const API_URL = "<?php echo $matomo_url; ?>";
const SITE_ID = "<?php echo $id_site; ?>";
const TOKEN = "<?php echo $token_auth; ?>";
const getEl = (id) => document.getElementById(id);
const buildUrl = (m, e = '') => `${API_URL}index.php?module=API&method=${m}&idSite=${SITE_ID}&format=JSON&token_auth=${TOKEN}${e}&random=${Date.now()}`;
const valOrUnk = (val) => (val && val !== '' && val !== '-' && val !== null) ? val : 'Desconocido';
function getMinutesSinceMidnight() {
const now = new Date();
const midnight = new Date(now.getFullYear(), now.getMonth(), now.getDate(), 0, 0, 0);
return Math.max(1, Math.floor((now - midnight) / 60000));
}
function getLocalDateStr() {
const d = new Date();
const year = d.getFullYear();
const month = String(d.getMonth() + 1).padStart(2, '0');
const day = String(d.getDate()).padStart(2, '0');
return `${year}-${month}-${day}`;
}
function getYesterdayDateStr() {
const d = new Date();
d.setDate(d.getDate() - 1);
const year = d.getFullYear();
const month = String(d.getMonth() + 1).padStart(2, '0');
const day = String(d.getDate()).padStart(2, '0');
return `${year}-${month}-${day}`;
}
function renderTrend(elementId, todayVal, yesterdayVal) {
const el = getEl(elementId);
if (yesterdayVal === 0) {
el.innerHTML = '<span class="trend-icon">−</span> 0%';
el.className = 'trend-badge trend-neutral';
el.title = `Ayer: 0`; return;
}
const diff = todayVal - yesterdayVal;
const percent = Math.round((Math.abs(diff) / yesterdayVal) * 100);
if (diff > 0) {
el.innerHTML = `<span class="trend-icon">▲</span> ${percent}%`;
el.className = 'trend-badge trend-up';
} else if (diff < 0) {
el.innerHTML = `<span class="trend-icon">▼</span> ${percent}%`;
el.className = 'trend-badge trend-down';
} else {
el.innerHTML = `<span class="trend-icon">=</span> 0%`;
el.className = 'trend-badge trend-neutral';
}
el.title = `Ayer: ${yesterdayVal}`;
}
// --- VARIABLES GLOBALES ---
let chartVisits = null;
let chartPerf = null;
let globalHistoryData = null;
async function fetchAllGraphs() {
const btnV = getEl('btn-refresh-visits');
const btnP = getEl('btn-refresh-perf');
if(btnV) btnV.classList.add('spinning');
if(btnP) btnP.classList.add('spinning');
try {
const todayStr = getLocalDateStr();
// 1. VISITAS (Histórico + Live)
const resVisits = await fetch(buildUrl('VisitsSummary.get', '&period=day&date=last30')).then(r => r.json());
globalHistoryData = resVisits;
const minsToday = getMinutesSinceMidnight();
const resLiveToday = await fetch(buildUrl('Live.getCounters', '&lastMinutes=' + minsToday)).then(r => r.json());
const liveVisitsVal = (resLiveToday && resLiveToday[0] && resLiveToday[0].visits) ? resLiveToday[0].visits : 0;
// 2. RENDIMIENTO (Histórico + "Today")
// Pedimos histórico
const resPerfHistory = await fetch(buildUrl('PagePerformance.get', '&period=day&date=last30')).then(r => r.json());
// Pedimos específicamente HOY para tener el dato fresco (aunque sea un cálculo lento, Matomo lo sirve)
const resPerfToday = await fetch(buildUrl('PagePerformance.get', '&period=day&date=today')).then(r => r.json());
// --- RENDER VISITAS ---
const labels = [];
const dataPoints = [];
for (const [dateStr, metrics] of Object.entries(resVisits)) {
const d = new Date(dateStr);
labels.push(d.toLocaleDateString('es-ES', {weekday:'short', day:'numeric', month:'short'}));
if (dateStr === todayStr) dataPoints.push(liveVisitsVal);
else dataPoints.push((metrics && metrics.nb_visits) ? metrics.nb_visits : 0);
}
if (chartVisits) chartVisits.destroy();
const ctxV = document.getElementById('matomoChart');
if(ctxV) {
chartVisits = new Chart(ctxV, {
type: 'line',
data: { labels: labels, datasets: [{ label: 'Visitas', data: dataPoints, borderColor: '#2271b1', backgroundColor: '#2271b1', borderWidth: 2, pointRadius: 3, pointHoverRadius: 5, tension: 0, fill: false }] },
options: { responsive: true, maintainAspectRatio: false, plugins: { legend: { display: false }, tooltip: { backgroundColor: 'rgba(0,0,0,0.9)', displayColors: false, callbacks: { label: (c) => c.parsed.y + ' Visitas' } } }, scales: { y: { beginAtZero: true }, x: { grid: { display: false } } } }
});
}
// --- RENDER RENDIMIENTO ---
// Arrays
const dsNetwork = [], dsServer = [], dsTransfer = [], dsDomProc = [], dsDomComp = [], dsOnLoad = [];
// Fusionamos Histórico + Hoy fresco
// Primero, iteramos el histórico. Si encontramos la fecha de hoy, la sustituimos.
for (const [dateStr, metrics] of Object.entries(resPerfHistory)) {
let finalMetrics = metrics;
// Si es HOY, usamos el dato fresco si existe (viene como array en resPerfToday)
if (dateStr === todayStr && resPerfToday && resPerfToday[0]) {
finalMetrics = resPerfToday[0];
}
dsNetwork.push(finalMetrics.avg_time_network || 0);
dsServer.push(finalMetrics.avg_time_server || 0);
dsTransfer.push(finalMetrics.avg_time_transfer || 0);
dsDomProc.push(finalMetrics.avg_time_dom_processing || 0);
dsDomComp.push(finalMetrics.avg_time_dom_completion || 0);
dsOnLoad.push(finalMetrics.avg_time_on_load || 0);
}
if (chartPerf) chartPerf.destroy();
const ctxP = document.getElementById('perfChart');
if(ctxP) {
chartPerf = new Chart(ctxP, {
type: 'bar',
data: {
labels: labels,
datasets: [
{ label: 'Tiempo de red medio', data: dsNetwork, backgroundColor: '#0077b6' },
{ label: 'Avg. server time', data: dsServer, backgroundColor: '#e08e0b' },
{ label: 'Avg. transfer time', data: dsTransfer, backgroundColor: '#d63638' },
{ label: 'Avg. DOM processing', data: dsDomProc, backgroundColor: '#6f42c1' },
{ label: 'Avg. DOM completion', data: dsDomComp, backgroundColor: '#28a745' },
{ label: 'Avg. on load time', data: dsOnLoad, backgroundColor: '#17a2b8' }
]
},
options: {
responsive: true,
maintainAspectRatio: false,
interaction: { mode: 'index', intersect: false },
scales: { x: { stacked: true, grid: { display: false } }, y: { stacked: true, beginAtZero: true } },
plugins: {
legend: { display: false },
tooltip: {
backgroundColor: 'rgba(0,0,0,0.9)',
titleFont: { size: 11 },
bodyFont: { size: 10 },
callbacks: {
label: function(context) {
let label = context.dataset.label || '';
let val = context.parsed.y !== null ? parseFloat(context.parsed.y).toFixed(2) + 's' : '';
return val + ' ' + label;
},
footer: function(tooltipItems) {
let sum = 0;
tooltipItems.forEach(function(tooltipItem) {
sum += tooltipItem.parsed.y;
});
return sum.toFixed(2) + 's Total';
}
}
}
}
}
});
}
} catch(e) { console.log("Error Graph: " + e); } finally {
if(btnV) btnV.classList.remove('spinning');
if(btnP) btnP.classList.remove('spinning');
}
}
// --- REAL TIME (Igual) ---
async function fetchRealTimeData() {
const dot = getEl('m-dot');
const status = getEl('m-status');
try {
dot.classList.add('active');
status.innerText = 'Actualizando...';
const minsToday = getMinutesSinceMidnight();
const [res3m, res30m, resTodayLive, res24h, resLog] = await Promise.all([
fetch(buildUrl('Live.getCounters', '&lastMinutes=3')).then(r => r.json()),
fetch(buildUrl('Live.getCounters', '&lastMinutes=30')).then(r => r.json()),
fetch(buildUrl('Live.getCounters', '&lastMinutes=' + minsToday)).then(r => r.json()),
fetch(buildUrl('Live.getCounters', '&lastMinutes=1440')).then(r => r.json()),
fetch(buildUrl('Live.getLastVisitsDetails', '&filter_limit=10')).then(r => r.json())
]);
if(res3m.result === 'error') throw new Error(res3m.message);
const todayVisits = resTodayLive[0]?.visits || 0;
const todayActions = resTodayLive[0]?.actions || 0;
const yesterdayStr = getYesterdayDateStr();
let yVisits = 0; let yActions = 0;
if (globalHistoryData && globalHistoryData[yesterdayStr]) {
yVisits = globalHistoryData[yesterdayStr].nb_visits || 0;
yActions = globalHistoryData[yesterdayStr].nb_actions || 0;
}
getEl('val-live').innerText = res3m[0]?.visits || 0;
getEl('val-live-vis').innerText = res3m[0]?.visits || 0;
getEl('val-live-act').innerText = res3m[0]?.actions || 0;
getEl('val-uniq').innerText = todayVisits;
getEl('val-page').innerText = todayActions;
renderTrend('trend-uniq', todayVisits, yVisits);
renderTrend('trend-page', todayActions, yActions);
getEl('val-24-v').innerText = (res24h[0]?.visits || 0) + ' Visitas';
getEl('val-24-a').innerText = (res24h[0]?.actions || 0) + ' Acciones';
getEl('val-30-v').innerText = (res30m[0]?.visits || 0) + ' Visitas';
getEl('val-30-a').innerText = (res30m[0]?.actions || 0) + ' Acciones';
let html = '';
if(resLog && resLog.length > 0) {
resLog.forEach(v => {
const fixUrl = (u) => u.startsWith('http') ? u : API_URL + u;
const tCountry = valOrUnk(v.countryPretty || v.country);
const tRegion = valOrUnk(v.region);
const tCity = valOrUnk(v.city);
const tIP = valOrUnk(v.visitIp);
const tID = valOrUnk(v.visitorId);
let rawLang = v.browserLanguage || v.languageCode;
let tLang = (rawLang && rawLang !== '-') ? 'Código de idioma ' + rawLang : 'Desconocido';
const rawDuration = v.visitDuration || 0;
let durationFormatted = '';
if (rawDuration > 0) {
const min = Math.floor(rawDuration / 60);
const sec = rawDuration % 60;
durationFormatted = `${min}m ${sec}s`;
}
const loadBadge = durationFormatted ? `<span class="load-time-badge">${durationFormatted}</span>` : '';
const flagTooltipHtml = `<div class="m-tooltip-box"><span class="ft-row"><span class="ft-label">País:</span> <span class="ft-val">${tCountry}</span></span><span class="ft-row"><span class="ft-label">Región:</span> <span class="ft-val">${tRegion}</span></span><span class="ft-row"><span class="ft-label">Ciudad:</span> <span class="ft-val">${tCity}</span></span><span class="ft-row"><span class="ft-label">Idioma:</span> <span class="ft-val">${tLang}</span></span><span class="ft-row"><span class="ft-label">IP:</span> <span class="ft-val">${tIP}</span></span><span class="ft-row"><span class="ft-label">ID:</span> <span class="ft-val">${tID}</span></span></div>`;
const flagImg = v.countryFlag ? `<img src="${fixUrl(v.countryFlag)}">` : '';
const flag = flagImg ? `<div class="flag-wrapper">${flagImg}${flagTooltipHtml}</div>` : '';
const date = new Date(v.serverTimestamp * 1000);
const timeStr = date.toLocaleTimeString([], {hour: '2-digit', minute:'2-digit', second:'2-digit'});
const dateStr = date.toLocaleDateString([], {weekday: 'short', day: 'numeric'});
const browser = v.browserIcon ? `<img src="${fixUrl(v.browserIcon)}" title="${v.browserName}">` : '';
const os = v.operatingSystemIcon ? `<img src="${fixUrl(v.operatingSystemIcon)}" title="${v.operatingSystemName}">` : '';
const profileUrl = `${API_URL}index.php?module=CoreHome&action=index&idSite=${SITE_ID}&period=day&date=today#?idSite=${SITE_ID}&period=day&date=today&category=Dashboard_Dashboard&subcategory=1&popover=visitorProfile%243A${v.visitorId}`;
let refHtml = 'Entrada directa';
if(v.referrerTypeName === 'Motores de búsqueda') {
refHtml = `<span style="color:#d63638;font-weight:bold">G</span> ${v.referrerName || ''}`;
if(v.referrerKeyword) refHtml += ` <i>"${v.referrerKeyword}"</i>`;
} else if(v.referrerTypeName === 'Sitios web') {
refHtml = `Ref: <a href="${v.referrerUrl}" target="_blank" style="color:#666">${v.referrerName}</a>`;
}
let actHtml = '';
if(v.actionDetails) {
v.actionDetails.forEach(a => {
if(a.type) {
let dashiconClass = 'dashicons-portfolio';
let isEvent = false;
let isSearch = false;
switch(a.type) {
case 'download': dashiconClass = 'dashicons-download'; break;
case 'outlink': dashiconClass = 'dashicons-external'; break;
case 'event': dashiconClass = 'dashicons-megaphone'; isEvent = true; break;
case 'search':
case 'siteSearch': dashiconClass = 'dashicons-search'; isSearch = true; break;
}
const pUrl = a.url || '#';
let actionDateStr = '';
if(a.timestamp) {
const ad = new Date(a.timestamp * 1000);
actionDateStr = ad.toLocaleDateString('es-ES', {day: 'numeric', month: 'short', year: 'numeric'}) + ' ' + ad.toLocaleTimeString();
}
let timeSpent = '0s';
if(a.timeSpent) {
const m = Math.floor(a.timeSpent / 60);
const s = a.timeSpent % 60;
timeSpent = (m > 0 ? m + 'm ' : '') + s + 's';
}
let tooltipInner = '';
if (isEvent) {
let evText = `Evento ${a.eventCategory || ''} - ${a.eventAction || ''}`;
if(a.eventName) evText += ` - ${a.eventName}`;
if(a.pageTitle) evText += ` - ${a.pageTitle}`;
const evValue = (a.eventValue !== undefined) ? a.eventValue : '0';
evText += ` - ${evValue}`;
tooltipInner = `<div class="at-title">${evText}</div><div class="at-meta">${actionDateStr}</div>`;
} else if (isSearch) {
const keyword = a.siteSearchKeyword || a.actionName || 'Sin palabras clave';
tooltipInner = `<div class="at-title">Búsqueda interna: ${keyword}</div><div class="at-meta">${actionDateStr}</div>`;
} else {
const pTitle = (a.pageTitle || 'Título desconocido').replace(/"/g, '"');
tooltipInner = `<div class="at-url">${pUrl}</div><div class="at-title">${pTitle}</div><div class="at-meta">${actionDateStr}</div><div class="at-meta">Tiempo en la página: ${timeSpent}</div>`;
}
actHtml += `<a href="${pUrl}" target="_blank" class="action-wrapper"><span class="dashicons ${dashiconClass}"></span><div class="m-tooltip-box">${tooltipInner}</div></a>`;
}
});
}
html += `
<div class="visitor-row">
<div class="v-line">
<b>${timeStr}</b> ${loadBadge}
<span style="font-size:11px;color:#888">(${dateStr})</span>
<span class="v-icons" style="display:flex;align-items:center;gap:3px;">${flag}${browser}${os}</span>
<a href="${profileUrl}" target="_blank" class="profile-link dashicons dashicons-businessperson" title="Ver Perfil"></a>
</div>
<div class="v-line v-ref">${refHtml}</div>
<div class="v-line v-actions">${actHtml}</div>
</div>`;
});
} else {
html = '<div style="padding:20px;text-align:center;color:#ccc;">Cargando...</div>';
}
getEl('log-content').innerHTML = html;
status.innerText = 'En vivo (Actualizado: ' + new Date().toLocaleTimeString() + ')';
} catch (err) {
getEl('m-error').style.display = 'block';
getEl('m-error').innerText = 'Error: ' + err.message;
status.innerText = 'Error';
} finally {
dot.classList.remove('active');
}
}
// Init
fetchAllGraphs();
fetchRealTimeData();
setInterval(fetchRealTimeData, 10000);
// Listeners para AMBOS botones
const btnV = getEl('btn-refresh-visits');
const btnP = getEl('btn-refresh-perf');
if(btnV) btnV.addEventListener('click', fetchAllGraphs);
if(btnP) btnP.addEventListener('click', fetchAllGraphs);
})();
</script>
<?php
}
}4. סיכום המאפיינים
ארכיטקטורה 100% JavaScript (צד לקוח): בניגוד לווידג'טים מסורתיים המשתמשים ב-PHP (cURL) כדי לבקש את הנתונים, ווידג'ט זה משתמש ב-JavaScript (fetch) ישירות מהדפדפן שלך.
- היתרון? שרת הוורדפרס שלך לא עובד. אין חסימות אבטחה בגלל קריאה עצמית (Loopback) ואין זמני טעינה איטיים בממשק הניהול. הטעינה היא אסינכרונית.
זמן אמת "טהור" (רענון אוטומטי): הווידג'ט מרענן באופן אוטומטי את המונים ואת יומן הביקורים כל 10 שניות. אתה יכול להשאיר את הכרטיסייה פתוחה ולראות איך נכנסים הביקורים והמונים עולים מבלי לגעת בשום דבר.
גרף היברידי חכם: הנה הטריק הטכני המעניין ביותר. Matomo נוטה "לאחסן" את הנתונים מדי שעה, ולכן הגרף של היום נוטה להיות לא מעודכן או אפסי. יישומון זה משלב שני מקורות נתונים:
תוצאה: גרף של 30 יום שבו הנקודה "היום" היא אמיתית ומדויקת. בנוסף, יש לו כפתור רענון ידני נפרד כדי לא להעמיס על ה-API שלא לצורך.
נתונים מה-29 הימים האחרונים: נלקחים מהארכיון ההיסטורי (טעינה מהירה).
היום: מחשב זאת בזמן אמת על ידי בקשה מה-API את הדקות שחלפו מחצות ועד לשנייה הנוכחית.
התוסף, בפיתוח
פונקציה זו, בהתאם להתפתחותה ההגיונית, ממשיכה בדרכה להפוך לתוסף שייקרא "Real-Time Widget for Matomo" ונשלח למאגר ב-10 בדצמבר 2025, בדיוק ביום שבו הסתיים תהליך הבדיקה והאישור של תוסף זה.
להלן פירוט החידושים של התוסף העתידי ביחס לפונקציה.
התראות בזמן אמת בדפדפן
החידוש העיקרי בגרסה היציבה האחרונה (1.2.0) הוא מערכת ההתראות הקופצות בדפדפן בזמן אמת, הניתנות להגדרה מממשק הניהול של התוסף.

בניגוד לתוספים אחרים התלויים במשימות Cron של השרת או בשירותי Web Push חיצוניים, מערכת ההתראות של Matomo Real-Time Widget פועלת במלואה בצד הלקוח (Client-Side). כך מובטח כי לא תהיה כל השפעה על ביצועי שרת WordPress, שכן הדפדפן של המשתמש הוא זה שמבצע את העבודה.
1. ארכיטקטורת "Polling" חכמה
הווידג'ט קובע מחזור עדכון (setInterval) כל 10 שניות. בכל מחזור, הוא פונה ישירות ל-API של Matomo כדי לקבל את מצב התעבורה הנוכחי.
- זיהוי שינויים: הסקריפט משווה את
ה-visitorIdשל הביקור האחרון ואת הספירה הכוללת של הביקורים הפעילים (last3Minutes) עם הנתונים המאוחסנים בזיכרון מהאיטרציה הקודמת. - API מקורי: אם מתגלה חידוש רלוונטי, נשלחת התראה לשולחן העבודה באמצעות ה-API המקורי של הדפדפן (
new Notification()), מה שמאפשר להתראות להופיע מחוץ לחלון הדפדפן, תוך שילוב עם מערכת ההפעלה (Windows/macOS/Linux).
2. לוגיקת התראה היברידית
התוסף מיישם לוגיקה מותנית מתקדמת כדי למנוע "עייפות מהתראות" מבלי לאבד מידע קריטי. בהתאם להגדרות המשתמש, המערכת מתנהגת בשתי דרכים:
- מצב "כל ביקור": מתריע על כל כניסה נפרדת. המערכת שולפת מטא-נתונים מה-API (מדינה, פעולה שבוצעה, כותרת הדף) כדי להציג סיכום קונטקסטואלי: "ביקור חדש מספרד צופה ב-[כותרת הפוסט]".

דוגמה להודעות במצב "כל ביקור".
- מצב "לפי סף" (לוגיקה היברידית): זוהי התכונה הבולטת ביותר בגרסה 1.2.0. היא משלבת ניטור פסיבי והתראה אקטיבית:
- אזור רגיל (מתחת לסף): אם אתה מגדיר את הסף ל-10 ויש לך 5 ביקורים, המערכת פועלת במצב מידע, ומודיעה על כל ביקור בנפרד.
- אזור התראה (מעל הסף): ברגע שהתנועה שווה או עולהעל הסף (למשל: 10), ההיגיון משתנה. הוא מפסיק להודיע על ביקורים בודדים והופך להתראה על תנועה גבוהה. הוא חוזר לצפצף רק אם המספר הכולל של הביקורים עולה (Rising Edge), וכך נמנע ספאם אם התנועה נשארת יציבה במספרים גבוהים.

דוגמה להתראה במצב "על סף" של תעבורה גבוהה פתאומית.
מצב הסף נועד לשמש התראה מיידית על שיאי תעבורה, למקרה שתצטרך ליצור דף סטטי כדי למתן את ההשפעה על השרת, או פשוט לדעת בכל רגע נתון מה מקור העלייה הפתאומית במספר הביקורים, לאחר שהגדרת את הסף המינימלי שממנו תתחיל לקבל התראות. כל שעליך לעשות הוא להשאיר את דף הווידג'ט פתוח ברקע, עם ההתראות מופעלות בהגדרות, כדי להתחיל לקבל אותן.
לגבי השמעת אודיו בהתראות, אלה המפרט הטכני:
3. מערכת שמע חזקה (מבוססת DOM)
כדי לעמוד במדיניות ההפעלה האוטומטית המחמירה של הדפדפנים המודרניים (Chrome, Edge, Safari), החוסמים השמעת צליל שלא הושמעה על ידי המשתמש, מיושם פתרון דו-שכבתי:
- אודיו ב-DOM: במקום ליצור אובייקטים
new Audio()בלתי יציבים ב-JavaScript (שלעתים קרובות נאספים על ידי Garbage Collector או נחסמים), התוסף מזריק אלמנט HTML<audio>מוסתר אך קבוע לדף. - נעילה באמצעות אינטראקציה: מאזין גלובלי מזהה את האינטראקציה הראשונה של המשתמש (לחיצה או מקש) כדי "לברך" את מערכת השמע, ומאפשר להתראות הבאות להישמע באופן אוטומטי ללא התערבות.
4. ניהול שגיאות וניידים
מכיוון שדפדפנים ניידים (Android Chrome / iOS Safari) מקפיאים תהליכים ברקע כדי לחסוך בסוללה ואינם תומכים בבונה ההודעות הקלאסי ללא Service Workers, התוסף כולל מערכת לטיפול בחריגים (try/catch). זה מאפשר לווידג'ט להמשיך לפעול ולעדכן נתונים חזותיים במובייל מבלי להיתקע, מה שמפחית באופן יעיל את הפונקציונליות: אם הוא לא יכול להפעיל את ההתראה המקורית, הוא פשוט מדלג עליה וממשיך לרשום את התעבורה על המסך.
אפשרות להסרה נקייה
התקנה נקייה מתווספת להגדרות התוסף כדי להסיר את האסימון ואת תצורת מסד הנתונים בעת מחיקת התוסף באמצעות הקובץ uninstall.php כדי לנהל את ניקוי הנתונים הללו.


