Es ist mehr als zwei Jahre her, dass ich Google Analytics aufgegeben habe und auf Matomo On-Premise (selbst gehostet) umgestiegen bin. Und ich bin so glücklich.
Wenn Sie Matomo On-Premise verwenden, wissen Sie bereits, dass es ein leistungsfähiges und vollständiges Tool ist, aber jedes Mal, wenn Sie die grundlegenden Statistiken sehen wollen, eine neue Registerkarte öffnen zu müssen, ist unbequem und vielleicht sogar zu anstrengend für Ihren Server, obwohl sich die Leistung seit den Anfängen, als es noch Piwic hieß und den Server mit Anfragen überschwemmte, stark verbessert hat.
Es gibt zwar Plugins zur Integration von Matomo, aber sie haben in der Regel zwei Probleme: Entweder zeigen sie iframes an, die aus Sicherheitsgründen blockiert sind, oder sie stellen synchrone PHP-Anfragen, die das Administrationspanel verlangsamen.
Widget, das von der Matomo-API abgerufen wird
Ich wollte mit Hilfe der Matomo-API ein natives Widget für den WordPress-Desktop erstellen, das leicht, ästhetisch und vor allem in Echtzeit ist, aber keine Auswirkungen auf den Server hat und alles im Browser des Kunden läuft. Dabei stützte ich mich auf die Dokumentation von Matomo und die Hilfe von Gemini 3.0, das in seiner kürzlich veröffentlichten Version in Bezug auf die Behandlung des Codes stark verbessert wurde.
Achtung: Das Widget ist für On-Premise-Installationen gedacht (gleicher oder eigener Server), obwohl es, da es JS ist, auch funktionieren würde, wenn Sie Matomo in einer anderen Domain haben, solange die CORS (Browser-Berechtigungen) es erlauben.
Nach der Erklärung der Funktionen und wie man sie hinzufügt, finden Sie den kompletten Code, um sie in die functions.php Ihres Templates, Child-Themes oder mit Ihrem Snippets-Plugin einzufügen und Ihre URL, Ihre Projekt-ID und das Matomo Auth Token einzubinden.
Grundlegende Echtzeitdaten
Da ich nicht viele Metriken im Dashboard benötige, habe ich es mit den drei grundlegenden Boxen eingerichtet, die ich routinemäßig konsultiere.
Der erste ist der Online-Besucherzähler, der automatisch alle zehn Sekunden aktualisiert wird.
Darunter befinden sich zwei Felder mit der Gesamtzahl der Besuche für den Tag und rechts das Feld "Aktionen", ebenfalls für den Tag, das Matomo zwar als "Impressionen" bezeichnet, was aber nicht ganz korrekt ist, da es auch andere Aktionen wie das Öffnen eines Bildes, das Durchführen einer Suche, das Auslösen eines Klick-Ereignisses oder das Klicken auf einen Link zu einer externen URL berücksichtigt. Beide Boxen werden mit 30 Tagen historischer Daten und einer Echtzeit-Dateninjektion betrieben.

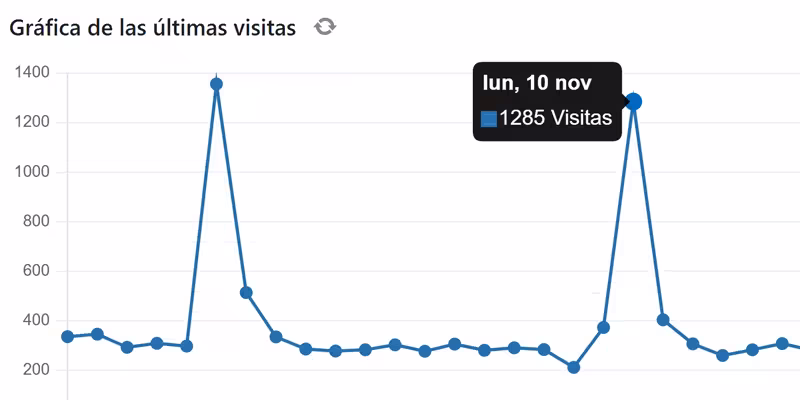
Das Besuchsdiagramm ist das einzige Feld, das nicht in Echtzeit aktualisiert wird, da es nicht sinnvoll ist, unnötige Anfragen für Daten zu erzwingen, die wir bereits im Feld "Besuche (heute)" haben, und eine Aktualisierungsschaltfläche hinzugefügt wurde, um das Diagramm jederzeit nur einmal zu aktualisieren. Nachstehend finden Sie einen Link zum Herunterladen einer CSV-Datei oder eines Bildes des Diagramms der letzten 30 Tage.
Für dieses Diagramm verwenden wir die Chart.js-Bibliothek, mit der das Diagramm anstelle eines statischen Bildes gezeichnet werden kann, was Interaktion ermöglicht und die Möglichkeit bietet, die Daten pro Tag an den einzelnen Punkten zu sehen.

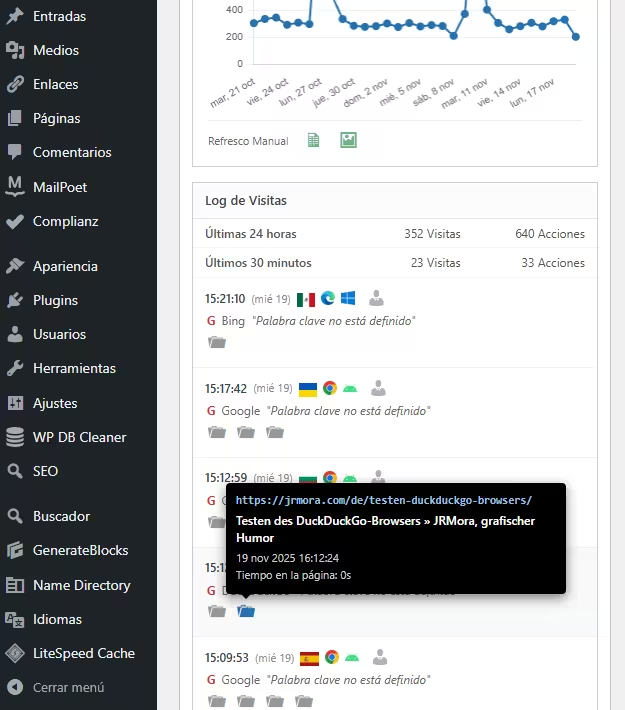
Das vierte Feld ist ein detailliertes Besucherprotokoll, das Banner, Browser, Betriebssysteme und einen Link zu einem eigenen Besucherprofilbericht enthält. Alle Aktionen werden visuell mit entsprechenden Symbolen für Besuche, Downloads (von Bildern oder PDFs oder was auch immer), Klicks auf externe Links, interne Website-Suchen und Ereignisse dargestellt.

Die Icons haben"reichhaltige" Tooltips in Form von schwarzen Kästen, die den nativen Matomo-Stil mit allen relevanten Mindestinformationen imitieren.

Zu befolgende Schritte
1. deinen Matomo-Token erhalten
Du brauchst einen "Schlüssel", damit dein WordPress mit deinem Matomo "kommunizieren" kann:
- Gib deinen Matomo ein.
- Gehen Sie zu Verwaltung (Zahnrad) > Personal > Sicherheit.
- Erstellen Sie ein neues Auth Token. Kopieren Sie diese Zeichenfolge. Schreiben Sie sie sofort auf und speichern Sie sie, denn sie wird nur einmal angezeigt und wenn Sie sie verlieren, müssen Sie eine neue erstellen.
Vergewissern Sie sich, dass die beiden angezeigten Kästchen NICHT angekreuzt sind; falls doch, deaktivieren Sie sie, damit sie wie auf dem Bild angezeigt werden:

2. Konfiguration
Nachdem Sie den Code in Ihre functions.php eingefügt haben, bearbeiten Sie einfach diese drei Zeilen in // --- CONFIGURATION ---, um Ihre Daten hinzuzufügen:
$matomo_url  = 'https://tu-dominio.com/matomo/'; // La URL donde tienes instalado Matomo
$id_site     = '1'; // El ID de tu sitio (suele ser 1)
$token_auth  = 'PEGA_AQUI_TU_TOKEN_DE_32_CARACTERES';
3. Code
/**
* Widget Matomo V25 - Dashboard Matomo Tiempo Real + Tooltip + Gráfica
*/
if ( ! function_exists( 'jrmora_widget_matomo_v25' ) ) {
function jrmora_widget_matomo_v25() {
wp_add_dashboard_widget(
'jrmora_matomo_widget_v25',
'Estadísticas Matomo (En Vivo)',
'jrmora_render_matomo_v25'
);
}
add_action( 'wp_dashboard_setup', 'jrmora_widget_matomo_v25' );
function jrmora_render_matomo_v25() {
// --- CONFIGURACIÓN ---
$matomo_url = 'https://tu-dominio.com/matomo/'; // La URL donde tienes instalado Matomo
$id_site = '1'; // El ID de tu sitio (suele ser 1)
$token_auth = 'PEGA_AQUI_TU_TOKEN_DE_32_CARACTERES';
// ---------------------
$export_csv = $matomo_url . "index.php?module=API&method=VisitsSummary.get&idSite=$id_site&period=day&date=last30&format=CSV&token_auth=$token_auth";
$export_img = $matomo_url . "index.php?module=API&method=ImageGraph.get&idSite=$id_site&apiModule=VisitsSummary&apiAction=get&token_auth=$token_auth&graphType=evolution&period=day&date=last30&width=800&height=400";
?>
<script src="https://cdn.jsdelivr.net/npm/chart.js"></script>
<style>
.matomo-js-wrapper { font-family: -apple-system, BlinkMacSystemFont, "Segoe UI", Roboto, sans-serif; position: relative; min-height: 250px; }
.status-bar { text-align: right; font-size: 11px; color: #888; margin-bottom: 10px; margin-top: -30px; }
.loading-dot { display: inline-block; width: 8px; height: 8px; background-color: #ccc; border-radius: 50%; margin-right: 5px; transition: background 0.3s; }
.loading-dot.active { background-color: #2271b1; box-shadow: 0 0 5px #2271b1; }
.hero-box { background: #fff; border: 1px solid #ccd0d4; border-left: 4px solid #2271b1; padding: 20px; text-align: center; margin-bottom: 15px; box-shadow: 0 1px 2px rgba(0,0,0,0.05); }
.hero-num { font-size: 64px; font-weight: 700; color: #1d2327; line-height: 1; display: block; margin-bottom: 5px; }
.hero-desc { font-size: 13px; color: #646970; }
.kpi-grid { display: flex; gap: 10px; margin-bottom: 15px; }
.kpi-card { background: #fff; border: 1px solid #ccd0d4; padding: 10px; flex: 1; text-align: center; }
.kpi-card h4 { margin: 0; font-size: 11px; color: #666; text-transform: uppercase; }
.kpi-card .val { font-size: 22px; font-weight: 600; color: #333; display: block; margin-top: 5px; }
/* GRAPH */
.graph-container { background: #fff; border: 1px solid #ccd0d4; margin-bottom: 15px; padding: 15px; position: relative; }
.graph-header { display: flex; justify-content: space-between; align-items: center; margin-bottom: 10px; }
.graph-title-area { display: flex; align-items: center; gap: 8px; }
.graph-title { font-size: 14px; font-weight: 600; color: #1d2327; }
.btn-graph-refresh { cursor: pointer; color: #888; font-size: 16px; display: flex; align-items: center; justify-content: center; width: 20px; height: 20px; border-radius: 50%; transition: all 0.3s; }
.btn-graph-refresh:hover { background: #f0f0f1; color: #2271b1; }
.btn-graph-refresh.spinning { animation: spin 1s linear infinite; color: #2271b1; }
@keyframes spin { 100% { transform: rotate(360deg); } }
.graph-legend { font-size: 11px; color: #2271b1; font-weight: 600; display: flex; align-items: center; gap: 5px; }
.graph-legend span { display: inline-block; width: 12px; height: 2px; background: #2271b1; }
.chart-canvas-box { position: relative; height: 250px; width: 100%; }
.graph-actions { display: flex; gap: 15px; padding-top: 10px; border-top: 1px solid #eee; margin-top: 5px; justify-content: flex-start; }
.action-icon { text-decoration: none; color: #2e8b57; font-size: 18px; opacity: 0.7; transition: opacity 0.2s; }
.action-icon:hover { opacity: 1; color: #1e7040; }
/* LOG */
.log-container { border: 1px solid #ccd0d4; background: #fff; }
.log-header { background: #fcfcfc; padding: 8px 12px; border-bottom: 1px solid #e5e5e5; font-weight: 600; font-size: 13px; }
.summary-table { width: 100%; font-size: 12px; border-collapse: collapse; border-bottom: 1px solid #eee; }
.summary-table td { padding: 6px 12px; border-bottom: 1px solid #f6f6f6; text-align: right; color: #555; }
.summary-table td:first-child { text-align: left; font-weight: 500; }
.visitor-row { padding: 10px 12px; border-bottom: 1px solid #f0f0f1; font-size: 12px; }
.visitor-row:hover { background: #f8f9fa; }
.v-line { display: flex; align-items: center; gap: 6px; margin-bottom: 4px; position: relative; }
.v-icons img { height: 14px; vertical-align: middle; margin-right: 3px; }
.v-ref { color: #666; margin-left: 2px; }
.v-actions { margin-top: 4px; margin-left: 2px; color: #888; display: flex; flex-wrap: wrap; gap: 4px; }
.error-box { color: red; padding: 20px; text-align: center; display: none; }
/* TOOLTIPS */
.m-tooltip-box { visibility: hidden; background-color: #000; color: #fff; text-align: left; border-radius: 4px; padding: 10px; position: absolute; z-index: 99999; bottom: 135%; opacity: 0; transition: opacity 0.2s; font-size: 11px; line-height: 1.4; box-shadow: 0 4px 12px rgba(0,0,0,0.5); pointer-events: none; white-space: normal; }
.m-tooltip-box::after { content: ""; position: absolute; top: 100%; left: 20px; margin-left: -5px; border-width: 5px; border-style: solid; border-color: #000 transparent transparent transparent; }
.flag-wrapper { position: relative; display: inline-block; cursor: help; }
.flag-wrapper .m-tooltip-box { width: 280px; left: 50%; margin-left: -20px; }
.flag-wrapper:hover .m-tooltip-box { visibility: visible; opacity: 1; }
.ft-row { display: block; margin-bottom: 2px; }
.ft-label { color: #aaa; font-weight: 400; margin-right: 4px; }
.ft-val { color: #fff; font-weight: 600; }
.action-wrapper { position: relative; display: inline-block; margin-right: 5px; text-decoration: none; }
.action-wrapper .m-tooltip-box { width: 320px; left: -10px; bottom: 140%; }
.action-wrapper:hover .m-tooltip-box { visibility: visible; opacity: 1; }
.at-url { color: #9ec2e6; font-weight: 600; word-break: break-all; margin-bottom: 4px; font-family: monospace; font-size: 11px; }
.at-title { color: #fff; font-weight: 600; margin-bottom: 4px; font-size: 12px; display: block; }
.at-meta { color: #ccc; display: block; margin-bottom: 2px; }
.profile-link { color: #b0b0b0; text-decoration: none; cursor: pointer; margin-left: 2px; }
.profile-link:hover { color: #2271b1; }
/* ICONOS DASHICONS UNIFICADOS */
.action-wrapper .dashicons { font-size: 18px; color: #999; transition: color 0.2s; }
.action-wrapper:hover .dashicons { color: #2271b1; cursor: pointer; }
</style>
<div class="status-bar"><span class="loading-dot" id="m-dot"></span> <span id="m-status">Conectando...</span></div>
<div class="matomo-js-wrapper">
<div id="m-error" class="error-box"></div>
<div class="hero-box">
<span class="hero-num" id="val-live">--</span>
<div class="hero-desc"><span id="val-live-vis">--</span> visitas y <span id="val-live-act">--</span> acciones (últimos 3 min)</div>
</div>
<div class="kpi-grid">
<div class="kpi-card"><h4>Visitas (Hoy)</h4><span class="val" id="val-uniq">--</span></div>
<div class="kpi-card"><h4>Acciones (Hoy)</h4><span class="val" id="val-page">--</span></div>
</div>
<div class="graph-container">
<div class="graph-header">
<div class="graph-title-area">
<span class="graph-title">Gráfica de las últimas visitas</span>
<span id="btn-refresh-graph" class="btn-graph-refresh dashicons dashicons-update" title="Actualizar Gráfica"></span>
</div>
<div class="graph-legend"><span></span> Visitas (Sesiones)</div>
</div>
<div class="chart-canvas-box">
<canvas id="matomoChart"></canvas>
</div>
<div class="graph-actions">
<span style="font-size:11px; color:#666; padding-top:2px;">Últimos 30 días</span>
<a href="<?php echo esc_url($export_csv); ?>" target="_blank" class="action-icon dashicons dashicons-media-spreadsheet" title="Exportar CSV"></a>
<a href="<?php echo esc_url($export_img); ?>" target="_blank" class="action-icon dashicons dashicons-format-image" title="Descargar Imagen"></a>
</div>
</div>
<div class="log-container">
<div class="log-header">Log de Visitas</div>
<table class="summary-table">
<tr><td>Últimas 24 horas</td><td id="val-24-v">--</td><td id="val-24-a">--</td></tr>
<tr><td>Últimos 30 minutos</td><td id="val-30-v">--</td><td id="val-30-a">--</td></tr>
</table>
<div class="log-rows" id="log-content">
<div style="padding:20px; text-align:center; color:#ccc;">Cargando...</div>
</div>
</div>
</div>
<script>
(function() {
const API_URL = "<?php echo $matomo_url; ?>";
const SITE_ID = "<?php echo $id_site; ?>";
const TOKEN = "<?php echo $token_auth; ?>";
const getEl = (id) => document.getElementById(id);
const buildUrl = (m, e = '') => `${API_URL}index.php?module=API&method=${m}&idSite=${SITE_ID}&format=JSON&token_auth=${TOKEN}${e}&random=${Date.now()}`;
const valOrUnk = (val) => (val && val !== '' && val !== '-' && val !== null) ? val : 'Desconocido';
function getMinutesSinceMidnight() {
const now = new Date();
const midnight = new Date(now.getFullYear(), now.getMonth(), now.getDate(), 0, 0, 0);
return Math.max(1, Math.floor((now - midnight) / 60000));
}
function getLocalDateStr() {
const d = new Date();
const year = d.getFullYear();
const month = String(d.getMonth() + 1).padStart(2, '0');
const day = String(d.getDate()).padStart(2, '0');
return `${year}-${month}-${day}`;
}
// --- GRÁFICA ---
let myChart = null;
async function fetchGraphData() {
const btn = getEl('btn-refresh-graph');
const ctx = document.getElementById('matomoChart');
if(!ctx) return;
btn.classList.add('spinning');
try {
const resHistory = await fetch(buildUrl('VisitsSummary.get', '&period=day&date=last30')).then(r => r.json());
const minsToday = getMinutesSinceMidnight();
const resLiveToday = await fetch(buildUrl('Live.getCounters', '&lastMinutes=' + minsToday)).then(r => r.json());
if(resHistory.result === 'error') throw new Error('Error Gráfica');
const labels = [];
const dataPoints = [];
const todayStr = getLocalDateStr();
const liveVal = (resLiveToday && resLiveToday[0] && resLiveToday[0].visits) ? resLiveToday[0].visits : 0;
for (const [dateStr, metrics] of Object.entries(resHistory)) {
const d = new Date(dateStr);
const prettyDate = d.toLocaleDateString('es-ES', {weekday:'short', day:'numeric', month:'short'});
labels.push(prettyDate);
if (dateStr === todayStr) dataPoints.push(liveVal);
else dataPoints.push((metrics && metrics.nb_visits) ? metrics.nb_visits : 0);
}
if (myChart) myChart.destroy();
myChart = new Chart(ctx, {
type: 'line',
data: {
labels: labels,
datasets: [{
label: 'Visitas',
data: dataPoints,
borderColor: '#2271b1',
backgroundColor: '#2271b1',
borderWidth: 2,
pointRadius: 3,
pointHoverRadius: 5,
pointBackgroundColor: '#2271b1',
tension: 0,
fill: false
}]
},
options: {
responsive: true,
maintainAspectRatio: false,
plugins: {
legend: { display: false },
tooltip: {
backgroundColor: 'rgba(0, 0, 0, 0.9)',
titleColor: '#fff',
bodyColor: '#fff',
titleFont: { size: 13, weight: 'bold' },
bodyFont: { size: 13 },
displayColors: true,
boxWidth: 8,
boxHeight: 8,
callbacks: { label: (c) => c.parsed.y + ' Visitas' }
}
},
scales: {
y: { beginAtZero: true, grid: { color: '#f0f0f1' }, ticks: { font: { size: 10 }, color: '#666' } },
x: { grid: { display: false }, ticks: { font: { size: 10 }, color: '#666', maxTicksLimit: 10 } }
}
}
});
} catch(e) { console.log("Error: " + e); } finally { btn.classList.remove('spinning'); }
}
// --- REAL TIME ---
async function fetchRealTimeData() {
const dot = getEl('m-dot');
const status = getEl('m-status');
try {
dot.classList.add('active');
status.innerText = 'Actualizando...';
const minsToday = getMinutesSinceMidnight();
const [res3m, res30m, resTodayLive, res24h, resLog] = await Promise.all([
fetch(buildUrl('Live.getCounters', '&lastMinutes=3')).then(r => r.json()),
fetch(buildUrl('Live.getCounters', '&lastMinutes=30')).then(r => r.json()),
fetch(buildUrl('Live.getCounters', '&lastMinutes=' + minsToday)).then(r => r.json()),
fetch(buildUrl('Live.getCounters', '&lastMinutes=1440')).then(r => r.json()),
fetch(buildUrl('Live.getLastVisitsDetails', '&filter_limit=10')).then(r => r.json())
]);
if(res3m.result === 'error') throw new Error(res3m.message);
const v3m = res3m[0]?.visits || 0;
getEl('val-live').innerText = v3m;
getEl('val-live-vis').innerText = v3m;
getEl('val-live-act').innerText = res3m[0]?.actions || 0;
getEl('val-uniq').innerText = resTodayLive[0]?.visits || 0;
getEl('val-page').innerText = resTodayLive[0]?.actions || 0;
getEl('val-24-v').innerText = (res24h[0]?.visits || 0) + ' Visitas';
getEl('val-24-a').innerText = (res24h[0]?.actions || 0) + ' Acciones';
getEl('val-30-v').innerText = (res30m[0]?.visits || 0) + ' Visitas';
getEl('val-30-a').innerText = (res30m[0]?.actions || 0) + ' Acciones';
let html = '';
if(resLog && resLog.length > 0) {
resLog.forEach(v => {
const fixUrl = (u) => u.startsWith('http') ? u : API_URL + u;
const tCountry = valOrUnk(v.countryPretty || v.country);
const tRegion = valOrUnk(v.region);
const tCity = valOrUnk(v.city);
const tIP = valOrUnk(v.visitIp);
const tID = valOrUnk(v.visitorId);
let rawLang = v.browserLanguage || v.languageCode;
let tLang = (rawLang && rawLang !== '-') ? 'Código de idioma ' + rawLang : 'Desconocido';
const flagTooltipHtml = `<div class="m-tooltip-box"><span class="ft-row"><span class="ft-label">País:</span> <span class="ft-val">${tCountry}</span></span><span class="ft-row"><span class="ft-label">Región:</span> <span class="ft-val">${tRegion}</span></span><span class="ft-row"><span class="ft-label">Ciudad:</span> <span class="ft-val">${tCity}</span></span><span class="ft-row"><span class="ft-label">Idioma:</span> <span class="ft-val">${tLang}</span></span><span class="ft-row"><span class="ft-label">IP:</span> <span class="ft-val">${tIP}</span></span><span class="ft-row"><span class="ft-label">ID:</span> <span class="ft-val">${tID}</span></span></div>`;
const flagImg = v.countryFlag ? `<img src="${fixUrl(v.countryFlag)}">` : '';
const flag = flagImg ? `<div class="flag-wrapper">${flagImg}${flagTooltipHtml}</div>` : '';
const date = new Date(v.serverTimestamp * 1000);
const timeStr = date.toLocaleTimeString([], {hour: '2-digit', minute:'2-digit', second:'2-digit'});
const dateStr = date.toLocaleDateString([], {weekday: 'short', day: 'numeric'});
const browser = v.browserIcon ? `<img src="${fixUrl(v.browserIcon)}" title="${v.browserName}">` : '';
const os = v.operatingSystemIcon ? `<img src="${fixUrl(v.operatingSystemIcon)}" title="${v.operatingSystemName}">` : '';
const profileUrl = `${API_URL}index.php?module=CoreHome&action=index&idSite=${SITE_ID}&period=day&date=today#?idSite=${SITE_ID}&period=day&date=today&category=Dashboard_Dashboard&subcategory=1&popover=visitorProfile%243A${v.visitorId}`;
let refHtml = 'Entrada directa';
if(v.referrerTypeName === 'Motores de búsqueda') {
refHtml = `<span style="color:#d63638;font-weight:bold">G</span> ${v.referrerName || ''}`;
if(v.referrerKeyword) refHtml += ` <i>"${v.referrerKeyword}"</i>`;
} else if(v.referrerTypeName === 'Sitios web') {
refHtml = `Ref: <a href="${v.referrerUrl}" target="_blank" style="color:#666">${v.referrerName}</a>`;
}
let actHtml = '';
if(v.actionDetails) {
v.actionDetails.forEach(a => {
if(a.type) {
let dashiconClass = 'dashicons-portfolio'; // Default
let isEvent = false;
let isSearch = false;
switch(a.type) {
case 'download': dashiconClass = 'dashicons-download'; break;
case 'outlink': dashiconClass = 'dashicons-external'; break;
case 'event': dashiconClass = 'dashicons-megaphone'; isEvent = true; break;
case 'search':
case 'siteSearch':
dashiconClass = 'dashicons-search';
isSearch = true;
break;
}
const pUrl = a.url || '#';
let actionDateStr = '';
if(a.timestamp) {
const ad = new Date(a.timestamp * 1000);
actionDateStr = ad.toLocaleDateString('es-ES', {day: 'numeric', month: 'short', year: 'numeric'}) + ' ' + ad.toLocaleTimeString();
}
let timeSpent = '0s';
if(a.timeSpent) {
const m = Math.floor(a.timeSpent / 60);
const s = a.timeSpent % 60;
timeSpent = (m > 0 ? m + 'm ' : '') + s + 's';
}
// CONSTRUCCIÓN TOOLTIP
let tooltipInner = '';
if (isEvent) {
let evText = `Evento ${a.eventCategory || ''} - ${a.eventAction || ''}`;
if(a.eventName) evText += ` - ${a.eventName}`;
if(a.pageTitle) evText += ` - ${a.pageTitle}`;
const evValue = (a.eventValue !== undefined) ? a.eventValue : '0';
evText += ` - ${evValue}`;
tooltipInner = `<div class="at-title">${evText}</div><div class="at-meta">${actionDateStr}</div>`;
} else if (isSearch) {
// Lógica Búsqueda Interna
const keyword = a.siteSearchKeyword || a.actionName || 'Sin palabras clave';
tooltipInner = `<div class="at-title">Búsqueda interna: ${keyword}</div><div class="at-meta">${actionDateStr}</div>`;
} else {
// Lógica Estándar
const pTitle = (a.pageTitle || 'Título desconocido').replace(/"/g, '"');
tooltipInner = `<div class="at-url">${pUrl}</div><div class="at-title">${pTitle}</div><div class="at-meta">${actionDateStr}</div><div class="at-meta">Tiempo en la página: ${timeSpent}</div>`;
}
actHtml += `<a href="${pUrl}" target="_blank" class="action-wrapper"><span class="dashicons ${dashiconClass}"></span><div class="m-tooltip-box">${tooltipInner}</div></a>`;
}
});
}
html += `
<div class="visitor-row">
<div class="v-line">
<b>${timeStr}</b> <span style="font-size:11px;color:#888">(${dateStr})</span>
<span class="v-icons" style="display:flex;align-items:center;gap:3px;">${flag}${browser}${os}</span>
<a href="${profileUrl}" target="_blank" class="profile-link dashicons dashicons-businessperson" title="Ver Perfil"></a>
</div>
<div class="v-line v-ref">${refHtml}</div>
<div class="v-line v-actions">${actHtml}</div>
</div>`;
});
} else {
html = '<div style="padding:20px;text-align:center;color:#999">Sin visitas recientes.</div>';
}
getEl('log-content').innerHTML = html;
status.innerText = 'En vivo (Actualizado: ' + new Date().toLocaleTimeString() + ')';
} catch (err) {
getEl('m-error').style.display = 'block';
getEl('m-error').innerText = 'Error: ' + err.message;
status.innerText = 'Error';
} finally {
dot.classList.remove('active');
}
}
fetchGraphData();
fetchRealTimeData();
setInterval(fetchRealTimeData, 10000);
getEl('btn-refresh-graph').addEventListener('click', function() { fetchGraphData(); });
})();
</script>
<?php
}
}4. Zusammenfassung der Merkmale
100% JavaScript-Architektur (Client-Side): Im Gegensatz zu herkömmlichen Widgets, die PHP(cURL) verwenden, um Daten abzufragen, verwendet dieses Widget JavaScript (Fetch) direkt von Ihrem Browser .
- Der Vorteil? Ihr WordPress-Server arbeitet nicht. Es gibt keine Sicherheitssperren für den Selbstaufruf (Loopback) und keine langsamen Ladezeiten im Adminbereich. Das Laden erfolgt asynchron.
Pure" Echtzeit (Auto-Refresh): Das Widget aktualisiert die Zähler und das Besucherprotokoll automatisch alle 10 Sekunden. Sie können die Registerkarte geöffnet lassen und beobachten, wie die Besucher eintreffen und die Zähler steigen, ohne etwas zu berühren.
Intelligente Hybrid-Grafiken: Hier ist der interessanteste technische Trick. Matomo "archiviert" die Daten normalerweise stündlich, so dass das heutige Diagramm oft veraltet oder null ist. Dieses Widget kombiniert zwei Datenquellen:
Ergebnis: Ein 30-Tage-Diagramm, bei dem der "Heute"-Punkt real und genau ist. Darüber hinaus verfügt es über eine separate manuelle Aktualisierungsschaltfläche, damit die API nicht unnötig überladen wird.
Daten der letzten 29 Tage: Daten aus dem historischen Archiv (schnelles Laden).
Heute: Dies wird in Echtzeit berechnet, indem die API nach den von Mitternacht bis zur aktuellen Sekunde verstrichenen Minuten gefragt wird.


