Google 애널리틱스 사용을 중단하고 마토모 온프레미스 (자체 호스팅)로 전환한 지 2년이 넘었습니다. 정말 행복합니다.
마토모 온프레미스를 사용하신다면 이미 강력하고 완벽한 도구라는 것을 알고 계시겠지만, 요청이 쇄도하여 서버를 먹어치우던 피윅이라는 이름으로 불리던 초기보다 성능이 많이 향상되긴 했지만 기본 통계를 보려면 매번 새 탭을 열어야 하는 것은 불편하고 서버에 너무 많은 부하를 주는 것일 수도 있습니다.
Matomo 통합 플러그인이 있지만 보안상의 이유로 차단된 아이프레임을 표시하거나 관리 패널의 속도를 저하시키는 동기식 PHP 요청을 하는 두 가지 문제가 있습니다.
마토모 API에서 위젯 가져오기
저는 가볍고 미적이며 무엇보다도 실시간이지만 서버에 전혀 영향을 미치지 않고 모든 것이 클라이언트의 브라우저에서 실행되는 Matomo API를 사용하여 WordPress 데스크톱 용 기본 위젯을 만들기 시작했습니다. 이를 위해 저는 Matomo의 문서와 최근 출시된 버전에서 코드 처리 측면에서 많이 개선된 Gemini 3.0의 도움을 받았는데, 코드가 깨지지 않고 세 줄 이상 작성하는 방법을 모르기 때문이었습니다.
경고: 위젯은 온프레미스 설치(동일한 서버 또는 자체 서버)를 위해 설계되었지만, JS이므로 CORS(브라우저 권한)가 허용하는 한 다른 도메인에 Matomo가 있는 경우에도 작동합니다.
기능과 추가 방법에 대한 설명이 끝나면 템플릿, 하위 테마 또는 스니펫 플러그인의 functions.php에 추가하고 URL, 프로젝트 ID 및 마토모 인증 토큰을 포함하는 전체 코드를 찾을 수 있습니다.
기본 실시간 데이터
위젯에 많은 메트릭이 필요하지 않기 때문에 저는 일상적으로 확인하는 세 가지 기본 상자로 위젯을 설정했습니다.
첫 번째는 10초마다 자동으로 업데이트되는 온라인 방문자 카운터입니다.
아래에는 두 개의 상자가 있으며, 오른쪽에는 해당 일의 총 방문 횟수가 표시되어 있고, 마토모에서는 '노출 수'라고 부르지만 실제로는 이미지 열기, 검색, 클릭 이벤트 트리거 또는 외부 URL 링크 클릭과 같은 다른 동작도 추가되므로 정확하지 않습니다. 두 상자 모두 30일간의 과거 데이터와 실시간 데이터 주입을 기반으로 합니다.

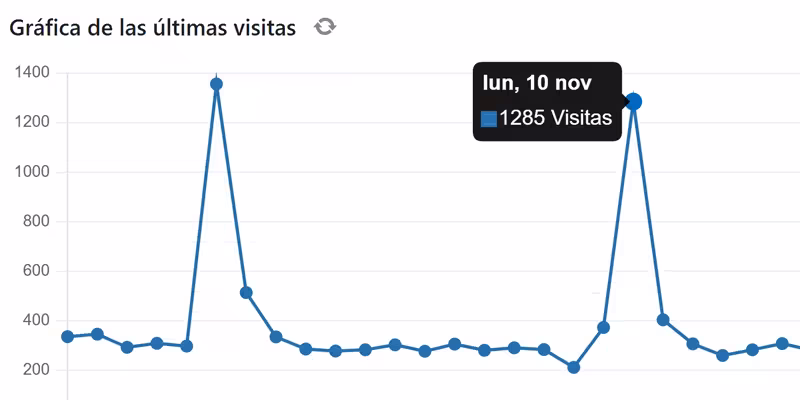
방문 그래프만 실시간으로 업데이트되지 않는 이유는 '방문(오늘)' 상자에 이미 있는 데이터를 불필요하게 요청하는 것은 의미가 없기 때문이며, 그래프를 언제든지 한 번만 새로 고칠 수 있도록 새로 고침 버튼이 추가되어 있습니다. 아래는 지난 30일간의 그래프에 대한 CSV 또는 이미지를 다운로드할 수 있는 링크입니다.
이 차트에서는 정적 이미지를 사용하는 대신 차트를 그릴 수 있는 Chart.js 라이브러리를 사용하여 상호 작용을 허용하고 포인트에서 일별 데이터를 볼 수 있도록 합니다.

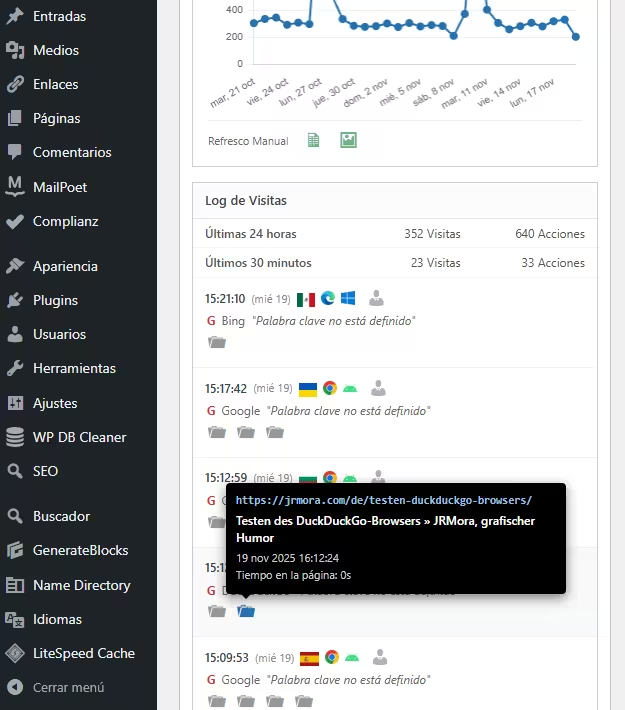
네 번째 상자는 배너, 브라우저, 운영 체제 및 기본 방문자 프로필 보고서로 연결되는 링크를 보여주는 자세한 방문자 로그입니다. 모든 작업은 방문, 다운로드(이미지 또는 PDF 등), 외부 링크 클릭, 내부 사이트 검색 및 이벤트에 대한 해당 아이콘으로 시각적으로 표시됩니다.

아이콘에는 최소한의 관련 정보와 함께 기본 마토모 스타일을 모방한 블랙박스 형태의'풍부한' 도구 설명이 있습니다.

따라야 할 단계
1. 마토모 토큰 받기
워드프레스가 마토모와 "통신"할 수 있도록 "키"가 필요합니다:
- 마토모를 입력합니다.
- 관리(기어) > 인사 > 보안으로 이동합니다.
- 새 인증 토큰을 만듭니다. 해당 문자열을 복사합니다. 한 번만 표시되며 분실하면 새로 만들어야 하므로 바로 적어 저장하세요.
표시되는 두 개의 상자가 선택되어 있지 않은지 확인해야 하며, 선택되어 있는 경우 이미지와 같이 표시되도록 선택을 취소해야 합니다:

2. 구성
functions.php에 코드를 추가한 후 // --- 구성 ---에서 이 세 줄을 편집하여 데이터를 추가합니다:
$matomo_url  = 'https://tu-dominio.com/matomo/'; // La URL donde tienes instalado Matomo
$id_site     = '1'; // El ID de tu sitio (suele ser 1)
$token_auth  = 'PEGA_AQUI_TU_TOKEN_DE_32_CARACTERES';
3. 코드
/**
* Widget Matomo V25 - Dashboard Matomo Tiempo Real + Tooltip + Gráfica
*/
if ( ! function_exists( 'jrmora_widget_matomo_v25' ) ) {
function jrmora_widget_matomo_v25() {
wp_add_dashboard_widget(
'jrmora_matomo_widget_v25',
'Estadísticas Matomo (En Vivo)',
'jrmora_render_matomo_v25'
);
}
add_action( 'wp_dashboard_setup', 'jrmora_widget_matomo_v25' );
function jrmora_render_matomo_v25() {
// --- CONFIGURACIÓN ---
$matomo_url = 'https://tu-dominio.com/matomo/'; // La URL donde tienes instalado Matomo
$id_site = '1'; // El ID de tu sitio (suele ser 1)
$token_auth = 'PEGA_AQUI_TU_TOKEN_DE_32_CARACTERES';
// ---------------------
$export_csv = $matomo_url . "index.php?module=API&method=VisitsSummary.get&idSite=$id_site&period=day&date=last30&format=CSV&token_auth=$token_auth";
$export_img = $matomo_url . "index.php?module=API&method=ImageGraph.get&idSite=$id_site&apiModule=VisitsSummary&apiAction=get&token_auth=$token_auth&graphType=evolution&period=day&date=last30&width=800&height=400";
?>
<script src="https://cdn.jsdelivr.net/npm/chart.js"></script>
<style>
.matomo-js-wrapper { font-family: -apple-system, BlinkMacSystemFont, "Segoe UI", Roboto, sans-serif; position: relative; min-height: 250px; }
.status-bar { text-align: right; font-size: 11px; color: #888; margin-bottom: 10px; margin-top: -30px; }
.loading-dot { display: inline-block; width: 8px; height: 8px; background-color: #ccc; border-radius: 50%; margin-right: 5px; transition: background 0.3s; }
.loading-dot.active { background-color: #2271b1; box-shadow: 0 0 5px #2271b1; }
.hero-box { background: #fff; border: 1px solid #ccd0d4; border-left: 4px solid #2271b1; padding: 20px; text-align: center; margin-bottom: 15px; box-shadow: 0 1px 2px rgba(0,0,0,0.05); }
.hero-num { font-size: 64px; font-weight: 700; color: #1d2327; line-height: 1; display: block; margin-bottom: 5px; }
.hero-desc { font-size: 13px; color: #646970; }
.kpi-grid { display: flex; gap: 10px; margin-bottom: 15px; }
.kpi-card { background: #fff; border: 1px solid #ccd0d4; padding: 10px; flex: 1; text-align: center; }
.kpi-card h4 { margin: 0; font-size: 11px; color: #666; text-transform: uppercase; }
.kpi-card .val { font-size: 22px; font-weight: 600; color: #333; display: block; margin-top: 5px; }
/* GRAPH */
.graph-container { background: #fff; border: 1px solid #ccd0d4; margin-bottom: 15px; padding: 15px; position: relative; }
.graph-header { display: flex; justify-content: space-between; align-items: center; margin-bottom: 10px; }
.graph-title-area { display: flex; align-items: center; gap: 8px; }
.graph-title { font-size: 14px; font-weight: 600; color: #1d2327; }
.btn-graph-refresh { cursor: pointer; color: #888; font-size: 16px; display: flex; align-items: center; justify-content: center; width: 20px; height: 20px; border-radius: 50%; transition: all 0.3s; }
.btn-graph-refresh:hover { background: #f0f0f1; color: #2271b1; }
.btn-graph-refresh.spinning { animation: spin 1s linear infinite; color: #2271b1; }
@keyframes spin { 100% { transform: rotate(360deg); } }
.graph-legend { font-size: 11px; color: #2271b1; font-weight: 600; display: flex; align-items: center; gap: 5px; }
.graph-legend span { display: inline-block; width: 12px; height: 2px; background: #2271b1; }
.chart-canvas-box { position: relative; height: 250px; width: 100%; }
.graph-actions { display: flex; gap: 15px; padding-top: 10px; border-top: 1px solid #eee; margin-top: 5px; justify-content: flex-start; }
.action-icon { text-decoration: none; color: #2e8b57; font-size: 18px; opacity: 0.7; transition: opacity 0.2s; }
.action-icon:hover { opacity: 1; color: #1e7040; }
/* LOG */
.log-container { border: 1px solid #ccd0d4; background: #fff; }
.log-header { background: #fcfcfc; padding: 8px 12px; border-bottom: 1px solid #e5e5e5; font-weight: 600; font-size: 13px; }
.summary-table { width: 100%; font-size: 12px; border-collapse: collapse; border-bottom: 1px solid #eee; }
.summary-table td { padding: 6px 12px; border-bottom: 1px solid #f6f6f6; text-align: right; color: #555; }
.summary-table td:first-child { text-align: left; font-weight: 500; }
.visitor-row { padding: 10px 12px; border-bottom: 1px solid #f0f0f1; font-size: 12px; }
.visitor-row:hover { background: #f8f9fa; }
.v-line { display: flex; align-items: center; gap: 6px; margin-bottom: 4px; position: relative; }
.v-icons img { height: 14px; vertical-align: middle; margin-right: 3px; }
.v-ref { color: #666; margin-left: 2px; }
.v-actions { margin-top: 4px; margin-left: 2px; color: #888; display: flex; flex-wrap: wrap; gap: 4px; }
.error-box { color: red; padding: 20px; text-align: center; display: none; }
/* TOOLTIPS */
.m-tooltip-box { visibility: hidden; background-color: #000; color: #fff; text-align: left; border-radius: 4px; padding: 10px; position: absolute; z-index: 99999; bottom: 135%; opacity: 0; transition: opacity 0.2s; font-size: 11px; line-height: 1.4; box-shadow: 0 4px 12px rgba(0,0,0,0.5); pointer-events: none; white-space: normal; }
.m-tooltip-box::after { content: ""; position: absolute; top: 100%; left: 20px; margin-left: -5px; border-width: 5px; border-style: solid; border-color: #000 transparent transparent transparent; }
.flag-wrapper { position: relative; display: inline-block; cursor: help; }
.flag-wrapper .m-tooltip-box { width: 280px; left: 50%; margin-left: -20px; }
.flag-wrapper:hover .m-tooltip-box { visibility: visible; opacity: 1; }
.ft-row { display: block; margin-bottom: 2px; }
.ft-label { color: #aaa; font-weight: 400; margin-right: 4px; }
.ft-val { color: #fff; font-weight: 600; }
.action-wrapper { position: relative; display: inline-block; margin-right: 5px; text-decoration: none; }
.action-wrapper .m-tooltip-box { width: 320px; left: -10px; bottom: 140%; }
.action-wrapper:hover .m-tooltip-box { visibility: visible; opacity: 1; }
.at-url { color: #9ec2e6; font-weight: 600; word-break: break-all; margin-bottom: 4px; font-family: monospace; font-size: 11px; }
.at-title { color: #fff; font-weight: 600; margin-bottom: 4px; font-size: 12px; display: block; }
.at-meta { color: #ccc; display: block; margin-bottom: 2px; }
.profile-link { color: #b0b0b0; text-decoration: none; cursor: pointer; margin-left: 2px; }
.profile-link:hover { color: #2271b1; }
/* ICONOS DASHICONS UNIFICADOS */
.action-wrapper .dashicons { font-size: 18px; color: #999; transition: color 0.2s; }
.action-wrapper:hover .dashicons { color: #2271b1; cursor: pointer; }
</style>
<div class="status-bar"><span class="loading-dot" id="m-dot"></span> <span id="m-status">Conectando...</span></div>
<div class="matomo-js-wrapper">
<div id="m-error" class="error-box"></div>
<div class="hero-box">
<span class="hero-num" id="val-live">--</span>
<div class="hero-desc"><span id="val-live-vis">--</span> visitas y <span id="val-live-act">--</span> acciones (últimos 3 min)</div>
</div>
<div class="kpi-grid">
<div class="kpi-card"><h4>Visitas (Hoy)</h4><span class="val" id="val-uniq">--</span></div>
<div class="kpi-card"><h4>Acciones (Hoy)</h4><span class="val" id="val-page">--</span></div>
</div>
<div class="graph-container">
<div class="graph-header">
<div class="graph-title-area">
<span class="graph-title">Gráfica de las últimas visitas</span>
<span id="btn-refresh-graph" class="btn-graph-refresh dashicons dashicons-update" title="Actualizar Gráfica"></span>
</div>
<div class="graph-legend"><span></span> Visitas (Sesiones)</div>
</div>
<div class="chart-canvas-box">
<canvas id="matomoChart"></canvas>
</div>
<div class="graph-actions">
<span style="font-size:11px; color:#666; padding-top:2px;">Últimos 30 días</span>
<a href="<?php echo esc_url($export_csv); ?>" target="_blank" class="action-icon dashicons dashicons-media-spreadsheet" title="Exportar CSV"></a>
<a href="<?php echo esc_url($export_img); ?>" target="_blank" class="action-icon dashicons dashicons-format-image" title="Descargar Imagen"></a>
</div>
</div>
<div class="log-container">
<div class="log-header">Log de Visitas</div>
<table class="summary-table">
<tr><td>Últimas 24 horas</td><td id="val-24-v">--</td><td id="val-24-a">--</td></tr>
<tr><td>Últimos 30 minutos</td><td id="val-30-v">--</td><td id="val-30-a">--</td></tr>
</table>
<div class="log-rows" id="log-content">
<div style="padding:20px; text-align:center; color:#ccc;">Cargando...</div>
</div>
</div>
</div>
<script>
(function() {
const API_URL = "<?php echo $matomo_url; ?>";
const SITE_ID = "<?php echo $id_site; ?>";
const TOKEN = "<?php echo $token_auth; ?>";
const getEl = (id) => document.getElementById(id);
const buildUrl = (m, e = '') => `${API_URL}index.php?module=API&method=${m}&idSite=${SITE_ID}&format=JSON&token_auth=${TOKEN}${e}&random=${Date.now()}`;
const valOrUnk = (val) => (val && val !== '' && val !== '-' && val !== null) ? val : 'Desconocido';
function getMinutesSinceMidnight() {
const now = new Date();
const midnight = new Date(now.getFullYear(), now.getMonth(), now.getDate(), 0, 0, 0);
return Math.max(1, Math.floor((now - midnight) / 60000));
}
function getLocalDateStr() {
const d = new Date();
const year = d.getFullYear();
const month = String(d.getMonth() + 1).padStart(2, '0');
const day = String(d.getDate()).padStart(2, '0');
return `${year}-${month}-${day}`;
}
// --- GRÁFICA ---
let myChart = null;
async function fetchGraphData() {
const btn = getEl('btn-refresh-graph');
const ctx = document.getElementById('matomoChart');
if(!ctx) return;
btn.classList.add('spinning');
try {
const resHistory = await fetch(buildUrl('VisitsSummary.get', '&period=day&date=last30')).then(r => r.json());
const minsToday = getMinutesSinceMidnight();
const resLiveToday = await fetch(buildUrl('Live.getCounters', '&lastMinutes=' + minsToday)).then(r => r.json());
if(resHistory.result === 'error') throw new Error('Error Gráfica');
const labels = [];
const dataPoints = [];
const todayStr = getLocalDateStr();
const liveVal = (resLiveToday && resLiveToday[0] && resLiveToday[0].visits) ? resLiveToday[0].visits : 0;
for (const [dateStr, metrics] of Object.entries(resHistory)) {
const d = new Date(dateStr);
const prettyDate = d.toLocaleDateString('es-ES', {weekday:'short', day:'numeric', month:'short'});
labels.push(prettyDate);
if (dateStr === todayStr) dataPoints.push(liveVal);
else dataPoints.push((metrics && metrics.nb_visits) ? metrics.nb_visits : 0);
}
if (myChart) myChart.destroy();
myChart = new Chart(ctx, {
type: 'line',
data: {
labels: labels,
datasets: [{
label: 'Visitas',
data: dataPoints,
borderColor: '#2271b1',
backgroundColor: '#2271b1',
borderWidth: 2,
pointRadius: 3,
pointHoverRadius: 5,
pointBackgroundColor: '#2271b1',
tension: 0,
fill: false
}]
},
options: {
responsive: true,
maintainAspectRatio: false,
plugins: {
legend: { display: false },
tooltip: {
backgroundColor: 'rgba(0, 0, 0, 0.9)',
titleColor: '#fff',
bodyColor: '#fff',
titleFont: { size: 13, weight: 'bold' },
bodyFont: { size: 13 },
displayColors: true,
boxWidth: 8,
boxHeight: 8,
callbacks: { label: (c) => c.parsed.y + ' Visitas' }
}
},
scales: {
y: { beginAtZero: true, grid: { color: '#f0f0f1' }, ticks: { font: { size: 10 }, color: '#666' } },
x: { grid: { display: false }, ticks: { font: { size: 10 }, color: '#666', maxTicksLimit: 10 } }
}
}
});
} catch(e) { console.log("Error: " + e); } finally { btn.classList.remove('spinning'); }
}
// --- REAL TIME ---
async function fetchRealTimeData() {
const dot = getEl('m-dot');
const status = getEl('m-status');
try {
dot.classList.add('active');
status.innerText = 'Actualizando...';
const minsToday = getMinutesSinceMidnight();
const [res3m, res30m, resTodayLive, res24h, resLog] = await Promise.all([
fetch(buildUrl('Live.getCounters', '&lastMinutes=3')).then(r => r.json()),
fetch(buildUrl('Live.getCounters', '&lastMinutes=30')).then(r => r.json()),
fetch(buildUrl('Live.getCounters', '&lastMinutes=' + minsToday)).then(r => r.json()),
fetch(buildUrl('Live.getCounters', '&lastMinutes=1440')).then(r => r.json()),
fetch(buildUrl('Live.getLastVisitsDetails', '&filter_limit=10')).then(r => r.json())
]);
if(res3m.result === 'error') throw new Error(res3m.message);
const v3m = res3m[0]?.visits || 0;
getEl('val-live').innerText = v3m;
getEl('val-live-vis').innerText = v3m;
getEl('val-live-act').innerText = res3m[0]?.actions || 0;
getEl('val-uniq').innerText = resTodayLive[0]?.visits || 0;
getEl('val-page').innerText = resTodayLive[0]?.actions || 0;
getEl('val-24-v').innerText = (res24h[0]?.visits || 0) + ' Visitas';
getEl('val-24-a').innerText = (res24h[0]?.actions || 0) + ' Acciones';
getEl('val-30-v').innerText = (res30m[0]?.visits || 0) + ' Visitas';
getEl('val-30-a').innerText = (res30m[0]?.actions || 0) + ' Acciones';
let html = '';
if(resLog && resLog.length > 0) {
resLog.forEach(v => {
const fixUrl = (u) => u.startsWith('http') ? u : API_URL + u;
const tCountry = valOrUnk(v.countryPretty || v.country);
const tRegion = valOrUnk(v.region);
const tCity = valOrUnk(v.city);
const tIP = valOrUnk(v.visitIp);
const tID = valOrUnk(v.visitorId);
let rawLang = v.browserLanguage || v.languageCode;
let tLang = (rawLang && rawLang !== '-') ? 'Código de idioma ' + rawLang : 'Desconocido';
const flagTooltipHtml = `<div class="m-tooltip-box"><span class="ft-row"><span class="ft-label">País:</span> <span class="ft-val">${tCountry}</span></span><span class="ft-row"><span class="ft-label">Región:</span> <span class="ft-val">${tRegion}</span></span><span class="ft-row"><span class="ft-label">Ciudad:</span> <span class="ft-val">${tCity}</span></span><span class="ft-row"><span class="ft-label">Idioma:</span> <span class="ft-val">${tLang}</span></span><span class="ft-row"><span class="ft-label">IP:</span> <span class="ft-val">${tIP}</span></span><span class="ft-row"><span class="ft-label">ID:</span> <span class="ft-val">${tID}</span></span></div>`;
const flagImg = v.countryFlag ? `<img src="${fixUrl(v.countryFlag)}">` : '';
const flag = flagImg ? `<div class="flag-wrapper">${flagImg}${flagTooltipHtml}</div>` : '';
const date = new Date(v.serverTimestamp * 1000);
const timeStr = date.toLocaleTimeString([], {hour: '2-digit', minute:'2-digit', second:'2-digit'});
const dateStr = date.toLocaleDateString([], {weekday: 'short', day: 'numeric'});
const browser = v.browserIcon ? `<img src="${fixUrl(v.browserIcon)}" title="${v.browserName}">` : '';
const os = v.operatingSystemIcon ? `<img src="${fixUrl(v.operatingSystemIcon)}" title="${v.operatingSystemName}">` : '';
const profileUrl = `${API_URL}index.php?module=CoreHome&action=index&idSite=${SITE_ID}&period=day&date=today#?idSite=${SITE_ID}&period=day&date=today&category=Dashboard_Dashboard&subcategory=1&popover=visitorProfile%243A${v.visitorId}`;
let refHtml = 'Entrada directa';
if(v.referrerTypeName === 'Motores de búsqueda') {
refHtml = `<span style="color:#d63638;font-weight:bold">G</span> ${v.referrerName || ''}`;
if(v.referrerKeyword) refHtml += ` <i>"${v.referrerKeyword}"</i>`;
} else if(v.referrerTypeName === 'Sitios web') {
refHtml = `Ref: <a href="${v.referrerUrl}" target="_blank" style="color:#666">${v.referrerName}</a>`;
}
let actHtml = '';
if(v.actionDetails) {
v.actionDetails.forEach(a => {
if(a.type) {
let dashiconClass = 'dashicons-portfolio'; // Default
let isEvent = false;
let isSearch = false;
switch(a.type) {
case 'download': dashiconClass = 'dashicons-download'; break;
case 'outlink': dashiconClass = 'dashicons-external'; break;
case 'event': dashiconClass = 'dashicons-megaphone'; isEvent = true; break;
case 'search':
case 'siteSearch':
dashiconClass = 'dashicons-search';
isSearch = true;
break;
}
const pUrl = a.url || '#';
let actionDateStr = '';
if(a.timestamp) {
const ad = new Date(a.timestamp * 1000);
actionDateStr = ad.toLocaleDateString('es-ES', {day: 'numeric', month: 'short', year: 'numeric'}) + ' ' + ad.toLocaleTimeString();
}
let timeSpent = '0s';
if(a.timeSpent) {
const m = Math.floor(a.timeSpent / 60);
const s = a.timeSpent % 60;
timeSpent = (m > 0 ? m + 'm ' : '') + s + 's';
}
// CONSTRUCCIÓN TOOLTIP
let tooltipInner = '';
if (isEvent) {
let evText = `Evento ${a.eventCategory || ''} - ${a.eventAction || ''}`;
if(a.eventName) evText += ` - ${a.eventName}`;
if(a.pageTitle) evText += ` - ${a.pageTitle}`;
const evValue = (a.eventValue !== undefined) ? a.eventValue : '0';
evText += ` - ${evValue}`;
tooltipInner = `<div class="at-title">${evText}</div><div class="at-meta">${actionDateStr}</div>`;
} else if (isSearch) {
// Lógica Búsqueda Interna
const keyword = a.siteSearchKeyword || a.actionName || 'Sin palabras clave';
tooltipInner = `<div class="at-title">Búsqueda interna: ${keyword}</div><div class="at-meta">${actionDateStr}</div>`;
} else {
// Lógica Estándar
const pTitle = (a.pageTitle || 'Título desconocido').replace(/"/g, '"');
tooltipInner = `<div class="at-url">${pUrl}</div><div class="at-title">${pTitle}</div><div class="at-meta">${actionDateStr}</div><div class="at-meta">Tiempo en la página: ${timeSpent}</div>`;
}
actHtml += `<a href="${pUrl}" target="_blank" class="action-wrapper"><span class="dashicons ${dashiconClass}"></span><div class="m-tooltip-box">${tooltipInner}</div></a>`;
}
});
}
html += `
<div class="visitor-row">
<div class="v-line">
<b>${timeStr}</b> <span style="font-size:11px;color:#888">(${dateStr})</span>
<span class="v-icons" style="display:flex;align-items:center;gap:3px;">${flag}${browser}${os}</span>
<a href="${profileUrl}" target="_blank" class="profile-link dashicons dashicons-businessperson" title="Ver Perfil"></a>
</div>
<div class="v-line v-ref">${refHtml}</div>
<div class="v-line v-actions">${actHtml}</div>
</div>`;
});
} else {
html = '<div style="padding:20px;text-align:center;color:#999">Sin visitas recientes.</div>';
}
getEl('log-content').innerHTML = html;
status.innerText = 'En vivo (Actualizado: ' + new Date().toLocaleTimeString() + ')';
} catch (err) {
getEl('m-error').style.display = 'block';
getEl('m-error').innerText = 'Error: ' + err.message;
status.innerText = 'Error';
} finally {
dot.classList.remove('active');
}
}
fetchGraphData();
fetchRealTimeData();
setInterval(fetchRealTimeData, 10000);
getEl('btn-refresh-graph').addEventListener('click', function() { fetchGraphData(); });
})();
</script>
<?php
}
}4. 특성 요약
100% 자바스크립트 아키텍처(클라이언트 측): 이 위젯은 PHP(cURL)를 사용하여 데이터를 요청하는 기존 위젯과 달리 브라우저에서 직접 자바스크립트(페치) 를 사용합니다.
- 장점은? 워드프레스 서버가 작동하지 않습니다. 자체 호출에 대한 보안 잠금(루프백)이 없으며 관리자에서 로딩 시간이 느려지지 않습니다. 로딩은 비동기식입니다.
순수" 실시간(자동 새로 고침): 위젯이 10초마다 카운터와 방문자 로그를 자동으로 새로 고칩니다 . 탭을 열어두고 아무것도 건드리지 않고도 방문자가 들어오고 카운터가 올라가는 것을 볼 수 있습니다.
스마트 하이브리드 그래픽: 가장 흥미로운 기술적 트릭은 다음과 같습니다. 마토모는 보통 매 시간마다 데이터를 '보관'하기 때문에 오늘의 차트는 오래된 것이거나 0인 경우가 많습니다. 이 위젯은 두 개의 데이터 소스를 결합합니다:
결과: '오늘' 시점이 실제적이고 정확한 30일 차트입니다. 또한 별도의 수동 새로 고침 버튼이 있어 API가 불필요하게 복잡해지지 않습니다.
지난 29일간의 데이터: 기록 아카이브의 데이터(빠른 로딩)입니다.
오늘: 자정부터 현재 초까지 경과한 분을 API에 요청하여 실시간으로 계산합니다.


