Ir pagājuši vairāk nekā divi gadi, kopš es pārtraucu izmantot Google Analytics un pārgāju uz Matomo On-Premise (pašmāju). Un esmu tik laimīgs.
Ja izmantojat Matomo On-Premise, jūs jau zināt, ka tas ir spēcīgs un pilnvērtīgs rīks, taču tas, ka katru reizi, kad vēlaties apskatīt pamatstatistiku, jāatver jauna cilne, ir neērti un, iespējams, pat pārmērīgi noslogo jūsu serveri, lai gan tā veiktspēja ir ievērojami uzlabojusies kopš tā pirmsākumiem, kad tas tika saukts par Piwic, un pieprasījumi apēda serveri, tiklīdz tas bija nepieciešams.
Ir Matomo integrācijas spraudņi, taču tiem mēdz būt divas problēmas: vai nu tie attēlo iframes, kas tiek bloķētas drošības apsvērumu dēļ, vai arī tie veic sinhronus PHP pieprasījumus, kas palēnina administrēšanas paneļa darbību.
Logrīku izveide no Matomo API
Es nolēmu izveidot vietēju logrīku WordPress darbvirsmai, izmantojot Matomo API, kas būtu viegls, estētisks un, pats galvenais, reāllaika, bet tam nebūtu nekādas ietekmes uz serveri un viss darbotos klienta pārlūkprogrammā. Šim nolūkam es paļāvos uz Matomo dokumentāciju un Gemini 3.0 palīdzību, kas nesen iznākušajā versijā ir ļoti uzlabota gan koda apstrādes ziņā, gan tāpēc, ka es nezinu, kā uzrakstīt vairāk par trim rindiņām, kaut ko nesalaužot.
Brīdinājums: logrīks ir paredzēts On-Premise instalācijām (tas pats serveris vai savs serveris), lai gan, tā kā tas ir JS, tas darbotos arī tad, ja jums ir Matomo citā domēnā, ja vien CORS (pārlūkprogrammas atļaujas) to atļauj.
Pēc paskaidrojumu par tās funkcijām un kā to pievienot, Jūs atradīsiet pilnu kodu tikai jums pievienot to functions.php jūsu veidni, bērnu tēma vai ar savu fragmentu spraudnis un ietver savu URL, jūsu projekta ID un Matomo Auth Token.
Pamata reāllaika dati
Tā kā man logrīkā nav nepieciešams daudz metrikas, es iestatīju to ar trim pamatlaukiem, kurus regulāri pārbaudu.
Pirmais ir tiešsaistes apmeklētāju skaitītājs, kas tiek automātiski atjaunināts ik pēc desmit sekundēm.
Zemāk ir divas ailes ar kopējo apmeklējumu skaitu attiecīgajā dienā un pa labi aile "Darbības", arī attiecīgajā dienā, kas, lai gan Matomo to dēvē par "Iespaidiem", patiesībā nav gluži precīza, jo tajā ir iekļautas arī citas darbības, piemēram, attēla atvēršana, meklēšana, klikšķa notikuma aktivizēšana vai saites uz ārējo URL noklikšķināšana. Abiem lodziņiem tiek izmantoti 30 dienu vēsturiskie dati un reāllaika datu ievadīšana.

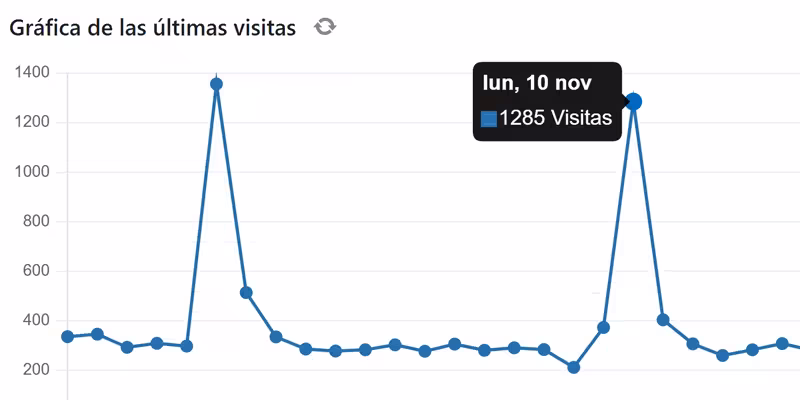
Apmeklējumu grafiks ir vienīgais lodziņš, kas netiek atjaunināts reāllaikā, jo nav lielas jēgas piespiedu kārtā pieprasīt nevajadzīgus datus, kas mums jau ir lodziņā "Apmeklējumi (šodien)", un ir pievienota atsvaidzināšanas poga, lai jebkurā brīdī atsvaidzinātu grafiku tikai vienu reizi. Zemāk ir saite, lai lejupielādētu CSV vai attēla grafiku par pēdējām 30 dienām.
Šim grafikam mēs izmantojam Chart.js bibliotēku, kas ļauj zīmēt grafiku, nevis izmantot statisku attēlu, nodrošinot mijiedarbību un iespēju redzēt datus pa dienām punktos.

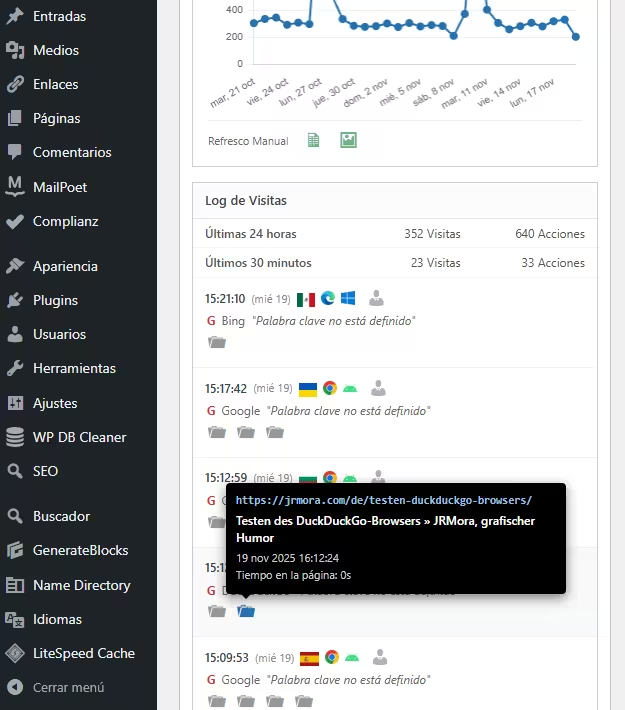
Ceturtajā lodziņā ir detalizēts apmeklētāju žurnāls, kurā ir norādīti: reklāmkarogi, pārlūkprogrammas, operētājsistēmas un saite uz vietējo apmeklētāju profila pārskatu. Visas darbības ir attēlotas vizuāli ar atbilstošām ikonām apmeklējumiem, lejupielādēm (attēlu, pdf vai citu dokumentu), klikšķiem uz ārējām saitēm, vietnes iekšējiem meklējumiem un notikumiem.

Ikonām ir"bagātīgi" rīkjoslas melnu lodziņu veidā, kas imitē vietējo Matomo stilu ar visu minimālo būtisko informāciju.

Veicamie pasākumi
1. Iegūstiet savu Matomo žetonu
Jums ir nepieciešama "atslēga", lai jūsu WordPress varētu "sazināties" ar jūsu Matomo:
- Ievadiet savu Matomo.
- Dodieties uz Administrācija (Gear) > Personāls > Drošība.
- Izveidojiet jaunu autentificēšanas žetonu. Kopējiet šo rakstzīmju virkni. Uzrakstiet to uzreiz un saglabājiet, jo tā tiks parādīta tikai vienu reizi, un, ja to pazaudēsiet, būs jāizveido jauna.
Jāpārliecinieties, ka šie divi lodziņi, kas parādās, NAV atzīmēti, un, ja ir, noņemiet tos, lai tie tiktu parādīti kā attēlā:

2. Konfigurācija
Pēc koda pievienošanas jūsu functions.php vienkārši rediģējiet šīs trīs rindiņas // --- KONFIGURĀCIJA ---, lai pievienotu savus datus:
$matomo_url  = 'https://tu-dominio.com/matomo/'; // La URL donde tienes instalado Matomo
$id_site     = '1'; // El ID de tu sitio (suele ser 1)
$token_auth  = 'PEGA_AQUI_TU_TOKEN_DE_32_CARACTERES';
3. Kods
/**
* Widget Matomo V25 - Dashboard Matomo Tiempo Real + Tooltip + Gráfica
*/
if ( ! function_exists( 'jrmora_widget_matomo_v25' ) ) {
function jrmora_widget_matomo_v25() {
wp_add_dashboard_widget(
'jrmora_matomo_widget_v25',
'Estadísticas Matomo (En Vivo)',
'jrmora_render_matomo_v25'
);
}
add_action( 'wp_dashboard_setup', 'jrmora_widget_matomo_v25' );
function jrmora_render_matomo_v25() {
// --- CONFIGURACIÓN ---
$matomo_url = 'https://tu-dominio.com/matomo/'; // La URL donde tienes instalado Matomo
$id_site = '1'; // El ID de tu sitio (suele ser 1)
$token_auth = 'PEGA_AQUI_TU_TOKEN_DE_32_CARACTERES';
// ---------------------
$export_csv = $matomo_url . "index.php?module=API&method=VisitsSummary.get&idSite=$id_site&period=day&date=last30&format=CSV&token_auth=$token_auth";
$export_img = $matomo_url . "index.php?module=API&method=ImageGraph.get&idSite=$id_site&apiModule=VisitsSummary&apiAction=get&token_auth=$token_auth&graphType=evolution&period=day&date=last30&width=800&height=400";
?>
<script src="https://cdn.jsdelivr.net/npm/chart.js"></script>
<style>
.matomo-js-wrapper { font-family: -apple-system, BlinkMacSystemFont, "Segoe UI", Roboto, sans-serif; position: relative; min-height: 250px; }
.status-bar { text-align: right; font-size: 11px; color: #888; margin-bottom: 10px; margin-top: -30px; }
.loading-dot { display: inline-block; width: 8px; height: 8px; background-color: #ccc; border-radius: 50%; margin-right: 5px; transition: background 0.3s; }
.loading-dot.active { background-color: #2271b1; box-shadow: 0 0 5px #2271b1; }
.hero-box { background: #fff; border: 1px solid #ccd0d4; border-left: 4px solid #2271b1; padding: 20px; text-align: center; margin-bottom: 15px; box-shadow: 0 1px 2px rgba(0,0,0,0.05); }
.hero-num { font-size: 64px; font-weight: 700; color: #1d2327; line-height: 1; display: block; margin-bottom: 5px; }
.hero-desc { font-size: 13px; color: #646970; }
.kpi-grid { display: flex; gap: 10px; margin-bottom: 15px; }
.kpi-card { background: #fff; border: 1px solid #ccd0d4; padding: 10px; flex: 1; text-align: center; }
.kpi-card h4 { margin: 0; font-size: 11px; color: #666; text-transform: uppercase; }
.kpi-card .val { font-size: 22px; font-weight: 600; color: #333; display: block; margin-top: 5px; }
/* GRAPH */
.graph-container { background: #fff; border: 1px solid #ccd0d4; margin-bottom: 15px; padding: 15px; position: relative; }
.graph-header { display: flex; justify-content: space-between; align-items: center; margin-bottom: 10px; }
.graph-title-area { display: flex; align-items: center; gap: 8px; }
.graph-title { font-size: 14px; font-weight: 600; color: #1d2327; }
.btn-graph-refresh { cursor: pointer; color: #888; font-size: 16px; display: flex; align-items: center; justify-content: center; width: 20px; height: 20px; border-radius: 50%; transition: all 0.3s; }
.btn-graph-refresh:hover { background: #f0f0f1; color: #2271b1; }
.btn-graph-refresh.spinning { animation: spin 1s linear infinite; color: #2271b1; }
@keyframes spin { 100% { transform: rotate(360deg); } }
.graph-legend { font-size: 11px; color: #2271b1; font-weight: 600; display: flex; align-items: center; gap: 5px; }
.graph-legend span { display: inline-block; width: 12px; height: 2px; background: #2271b1; }
.chart-canvas-box { position: relative; height: 250px; width: 100%; }
.graph-actions { display: flex; gap: 15px; padding-top: 10px; border-top: 1px solid #eee; margin-top: 5px; justify-content: flex-start; }
.action-icon { text-decoration: none; color: #2e8b57; font-size: 18px; opacity: 0.7; transition: opacity 0.2s; }
.action-icon:hover { opacity: 1; color: #1e7040; }
/* LOG */
.log-container { border: 1px solid #ccd0d4; background: #fff; }
.log-header { background: #fcfcfc; padding: 8px 12px; border-bottom: 1px solid #e5e5e5; font-weight: 600; font-size: 13px; }
.summary-table { width: 100%; font-size: 12px; border-collapse: collapse; border-bottom: 1px solid #eee; }
.summary-table td { padding: 6px 12px; border-bottom: 1px solid #f6f6f6; text-align: right; color: #555; }
.summary-table td:first-child { text-align: left; font-weight: 500; }
.visitor-row { padding: 10px 12px; border-bottom: 1px solid #f0f0f1; font-size: 12px; }
.visitor-row:hover { background: #f8f9fa; }
.v-line { display: flex; align-items: center; gap: 6px; margin-bottom: 4px; position: relative; }
.v-icons img { height: 14px; vertical-align: middle; margin-right: 3px; }
.v-ref { color: #666; margin-left: 2px; }
.v-actions { margin-top: 4px; margin-left: 2px; color: #888; display: flex; flex-wrap: wrap; gap: 4px; }
.error-box { color: red; padding: 20px; text-align: center; display: none; }
/* TOOLTIPS */
.m-tooltip-box { visibility: hidden; background-color: #000; color: #fff; text-align: left; border-radius: 4px; padding: 10px; position: absolute; z-index: 99999; bottom: 135%; opacity: 0; transition: opacity 0.2s; font-size: 11px; line-height: 1.4; box-shadow: 0 4px 12px rgba(0,0,0,0.5); pointer-events: none; white-space: normal; }
.m-tooltip-box::after { content: ""; position: absolute; top: 100%; left: 20px; margin-left: -5px; border-width: 5px; border-style: solid; border-color: #000 transparent transparent transparent; }
.flag-wrapper { position: relative; display: inline-block; cursor: help; }
.flag-wrapper .m-tooltip-box { width: 280px; left: 50%; margin-left: -20px; }
.flag-wrapper:hover .m-tooltip-box { visibility: visible; opacity: 1; }
.ft-row { display: block; margin-bottom: 2px; }
.ft-label { color: #aaa; font-weight: 400; margin-right: 4px; }
.ft-val { color: #fff; font-weight: 600; }
.action-wrapper { position: relative; display: inline-block; margin-right: 5px; text-decoration: none; }
.action-wrapper .m-tooltip-box { width: 320px; left: -10px; bottom: 140%; }
.action-wrapper:hover .m-tooltip-box { visibility: visible; opacity: 1; }
.at-url { color: #9ec2e6; font-weight: 600; word-break: break-all; margin-bottom: 4px; font-family: monospace; font-size: 11px; }
.at-title { color: #fff; font-weight: 600; margin-bottom: 4px; font-size: 12px; display: block; }
.at-meta { color: #ccc; display: block; margin-bottom: 2px; }
.profile-link { color: #b0b0b0; text-decoration: none; cursor: pointer; margin-left: 2px; }
.profile-link:hover { color: #2271b1; }
/* ICONOS DASHICONS UNIFICADOS */
.action-wrapper .dashicons { font-size: 18px; color: #999; transition: color 0.2s; }
.action-wrapper:hover .dashicons { color: #2271b1; cursor: pointer; }
</style>
<div class="status-bar"><span class="loading-dot" id="m-dot"></span> <span id="m-status">Conectando...</span></div>
<div class="matomo-js-wrapper">
<div id="m-error" class="error-box"></div>
<div class="hero-box">
<span class="hero-num" id="val-live">--</span>
<div class="hero-desc"><span id="val-live-vis">--</span> visitas y <span id="val-live-act">--</span> acciones (últimos 3 min)</div>
</div>
<div class="kpi-grid">
<div class="kpi-card"><h4>Visitas (Hoy)</h4><span class="val" id="val-uniq">--</span></div>
<div class="kpi-card"><h4>Acciones (Hoy)</h4><span class="val" id="val-page">--</span></div>
</div>
<div class="graph-container">
<div class="graph-header">
<div class="graph-title-area">
<span class="graph-title">Gráfica de las últimas visitas</span>
<span id="btn-refresh-graph" class="btn-graph-refresh dashicons dashicons-update" title="Actualizar Gráfica"></span>
</div>
<div class="graph-legend"><span></span> Visitas (Sesiones)</div>
</div>
<div class="chart-canvas-box">
<canvas id="matomoChart"></canvas>
</div>
<div class="graph-actions">
<span style="font-size:11px; color:#666; padding-top:2px;">Últimos 30 días</span>
<a href="<?php echo esc_url($export_csv); ?>" target="_blank" class="action-icon dashicons dashicons-media-spreadsheet" title="Exportar CSV"></a>
<a href="<?php echo esc_url($export_img); ?>" target="_blank" class="action-icon dashicons dashicons-format-image" title="Descargar Imagen"></a>
</div>
</div>
<div class="log-container">
<div class="log-header">Log de Visitas</div>
<table class="summary-table">
<tr><td>Últimas 24 horas</td><td id="val-24-v">--</td><td id="val-24-a">--</td></tr>
<tr><td>Últimos 30 minutos</td><td id="val-30-v">--</td><td id="val-30-a">--</td></tr>
</table>
<div class="log-rows" id="log-content">
<div style="padding:20px; text-align:center; color:#ccc;">Cargando...</div>
</div>
</div>
</div>
<script>
(function() {
const API_URL = "<?php echo $matomo_url; ?>";
const SITE_ID = "<?php echo $id_site; ?>";
const TOKEN = "<?php echo $token_auth; ?>";
const getEl = (id) => document.getElementById(id);
const buildUrl = (m, e = '') => `${API_URL}index.php?module=API&method=${m}&idSite=${SITE_ID}&format=JSON&token_auth=${TOKEN}${e}&random=${Date.now()}`;
const valOrUnk = (val) => (val && val !== '' && val !== '-' && val !== null) ? val : 'Desconocido';
function getMinutesSinceMidnight() {
const now = new Date();
const midnight = new Date(now.getFullYear(), now.getMonth(), now.getDate(), 0, 0, 0);
return Math.max(1, Math.floor((now - midnight) / 60000));
}
function getLocalDateStr() {
const d = new Date();
const year = d.getFullYear();
const month = String(d.getMonth() + 1).padStart(2, '0');
const day = String(d.getDate()).padStart(2, '0');
return `${year}-${month}-${day}`;
}
// --- GRÁFICA ---
let myChart = null;
async function fetchGraphData() {
const btn = getEl('btn-refresh-graph');
const ctx = document.getElementById('matomoChart');
if(!ctx) return;
btn.classList.add('spinning');
try {
const resHistory = await fetch(buildUrl('VisitsSummary.get', '&period=day&date=last30')).then(r => r.json());
const minsToday = getMinutesSinceMidnight();
const resLiveToday = await fetch(buildUrl('Live.getCounters', '&lastMinutes=' + minsToday)).then(r => r.json());
if(resHistory.result === 'error') throw new Error('Error Gráfica');
const labels = [];
const dataPoints = [];
const todayStr = getLocalDateStr();
const liveVal = (resLiveToday && resLiveToday[0] && resLiveToday[0].visits) ? resLiveToday[0].visits : 0;
for (const [dateStr, metrics] of Object.entries(resHistory)) {
const d = new Date(dateStr);
const prettyDate = d.toLocaleDateString('es-ES', {weekday:'short', day:'numeric', month:'short'});
labels.push(prettyDate);
if (dateStr === todayStr) dataPoints.push(liveVal);
else dataPoints.push((metrics && metrics.nb_visits) ? metrics.nb_visits : 0);
}
if (myChart) myChart.destroy();
myChart = new Chart(ctx, {
type: 'line',
data: {
labels: labels,
datasets: [{
label: 'Visitas',
data: dataPoints,
borderColor: '#2271b1',
backgroundColor: '#2271b1',
borderWidth: 2,
pointRadius: 3,
pointHoverRadius: 5,
pointBackgroundColor: '#2271b1',
tension: 0,
fill: false
}]
},
options: {
responsive: true,
maintainAspectRatio: false,
plugins: {
legend: { display: false },
tooltip: {
backgroundColor: 'rgba(0, 0, 0, 0.9)',
titleColor: '#fff',
bodyColor: '#fff',
titleFont: { size: 13, weight: 'bold' },
bodyFont: { size: 13 },
displayColors: true,
boxWidth: 8,
boxHeight: 8,
callbacks: { label: (c) => c.parsed.y + ' Visitas' }
}
},
scales: {
y: { beginAtZero: true, grid: { color: '#f0f0f1' }, ticks: { font: { size: 10 }, color: '#666' } },
x: { grid: { display: false }, ticks: { font: { size: 10 }, color: '#666', maxTicksLimit: 10 } }
}
}
});
} catch(e) { console.log("Error: " + e); } finally { btn.classList.remove('spinning'); }
}
// --- REAL TIME ---
async function fetchRealTimeData() {
const dot = getEl('m-dot');
const status = getEl('m-status');
try {
dot.classList.add('active');
status.innerText = 'Actualizando...';
const minsToday = getMinutesSinceMidnight();
const [res3m, res30m, resTodayLive, res24h, resLog] = await Promise.all([
fetch(buildUrl('Live.getCounters', '&lastMinutes=3')).then(r => r.json()),
fetch(buildUrl('Live.getCounters', '&lastMinutes=30')).then(r => r.json()),
fetch(buildUrl('Live.getCounters', '&lastMinutes=' + minsToday)).then(r => r.json()),
fetch(buildUrl('Live.getCounters', '&lastMinutes=1440')).then(r => r.json()),
fetch(buildUrl('Live.getLastVisitsDetails', '&filter_limit=10')).then(r => r.json())
]);
if(res3m.result === 'error') throw new Error(res3m.message);
const v3m = res3m[0]?.visits || 0;
getEl('val-live').innerText = v3m;
getEl('val-live-vis').innerText = v3m;
getEl('val-live-act').innerText = res3m[0]?.actions || 0;
getEl('val-uniq').innerText = resTodayLive[0]?.visits || 0;
getEl('val-page').innerText = resTodayLive[0]?.actions || 0;
getEl('val-24-v').innerText = (res24h[0]?.visits || 0) + ' Visitas';
getEl('val-24-a').innerText = (res24h[0]?.actions || 0) + ' Acciones';
getEl('val-30-v').innerText = (res30m[0]?.visits || 0) + ' Visitas';
getEl('val-30-a').innerText = (res30m[0]?.actions || 0) + ' Acciones';
let html = '';
if(resLog && resLog.length > 0) {
resLog.forEach(v => {
const fixUrl = (u) => u.startsWith('http') ? u : API_URL + u;
const tCountry = valOrUnk(v.countryPretty || v.country);
const tRegion = valOrUnk(v.region);
const tCity = valOrUnk(v.city);
const tIP = valOrUnk(v.visitIp);
const tID = valOrUnk(v.visitorId);
let rawLang = v.browserLanguage || v.languageCode;
let tLang = (rawLang && rawLang !== '-') ? 'Código de idioma ' + rawLang : 'Desconocido';
const flagTooltipHtml = `<div class="m-tooltip-box"><span class="ft-row"><span class="ft-label">País:</span> <span class="ft-val">${tCountry}</span></span><span class="ft-row"><span class="ft-label">Región:</span> <span class="ft-val">${tRegion}</span></span><span class="ft-row"><span class="ft-label">Ciudad:</span> <span class="ft-val">${tCity}</span></span><span class="ft-row"><span class="ft-label">Idioma:</span> <span class="ft-val">${tLang}</span></span><span class="ft-row"><span class="ft-label">IP:</span> <span class="ft-val">${tIP}</span></span><span class="ft-row"><span class="ft-label">ID:</span> <span class="ft-val">${tID}</span></span></div>`;
const flagImg = v.countryFlag ? `<img src="${fixUrl(v.countryFlag)}">` : '';
const flag = flagImg ? `<div class="flag-wrapper">${flagImg}${flagTooltipHtml}</div>` : '';
const date = new Date(v.serverTimestamp * 1000);
const timeStr = date.toLocaleTimeString([], {hour: '2-digit', minute:'2-digit', second:'2-digit'});
const dateStr = date.toLocaleDateString([], {weekday: 'short', day: 'numeric'});
const browser = v.browserIcon ? `<img src="${fixUrl(v.browserIcon)}" title="${v.browserName}">` : '';
const os = v.operatingSystemIcon ? `<img src="${fixUrl(v.operatingSystemIcon)}" title="${v.operatingSystemName}">` : '';
const profileUrl = `${API_URL}index.php?module=CoreHome&action=index&idSite=${SITE_ID}&period=day&date=today#?idSite=${SITE_ID}&period=day&date=today&category=Dashboard_Dashboard&subcategory=1&popover=visitorProfile%243A${v.visitorId}`;
let refHtml = 'Entrada directa';
if(v.referrerTypeName === 'Motores de búsqueda') {
refHtml = `<span style="color:#d63638;font-weight:bold">G</span> ${v.referrerName || ''}`;
if(v.referrerKeyword) refHtml += ` <i>"${v.referrerKeyword}"</i>`;
} else if(v.referrerTypeName === 'Sitios web') {
refHtml = `Ref: <a href="${v.referrerUrl}" target="_blank" style="color:#666">${v.referrerName}</a>`;
}
let actHtml = '';
if(v.actionDetails) {
v.actionDetails.forEach(a => {
if(a.type) {
let dashiconClass = 'dashicons-portfolio'; // Default
let isEvent = false;
let isSearch = false;
switch(a.type) {
case 'download': dashiconClass = 'dashicons-download'; break;
case 'outlink': dashiconClass = 'dashicons-external'; break;
case 'event': dashiconClass = 'dashicons-megaphone'; isEvent = true; break;
case 'search':
case 'siteSearch':
dashiconClass = 'dashicons-search';
isSearch = true;
break;
}
const pUrl = a.url || '#';
let actionDateStr = '';
if(a.timestamp) {
const ad = new Date(a.timestamp * 1000);
actionDateStr = ad.toLocaleDateString('es-ES', {day: 'numeric', month: 'short', year: 'numeric'}) + ' ' + ad.toLocaleTimeString();
}
let timeSpent = '0s';
if(a.timeSpent) {
const m = Math.floor(a.timeSpent / 60);
const s = a.timeSpent % 60;
timeSpent = (m > 0 ? m + 'm ' : '') + s + 's';
}
// CONSTRUCCIÓN TOOLTIP
let tooltipInner = '';
if (isEvent) {
let evText = `Evento ${a.eventCategory || ''} - ${a.eventAction || ''}`;
if(a.eventName) evText += ` - ${a.eventName}`;
if(a.pageTitle) evText += ` - ${a.pageTitle}`;
const evValue = (a.eventValue !== undefined) ? a.eventValue : '0';
evText += ` - ${evValue}`;
tooltipInner = `<div class="at-title">${evText}</div><div class="at-meta">${actionDateStr}</div>`;
} else if (isSearch) {
// Lógica Búsqueda Interna
const keyword = a.siteSearchKeyword || a.actionName || 'Sin palabras clave';
tooltipInner = `<div class="at-title">Búsqueda interna: ${keyword}</div><div class="at-meta">${actionDateStr}</div>`;
} else {
// Lógica Estándar
const pTitle = (a.pageTitle || 'Título desconocido').replace(/"/g, '"');
tooltipInner = `<div class="at-url">${pUrl}</div><div class="at-title">${pTitle}</div><div class="at-meta">${actionDateStr}</div><div class="at-meta">Tiempo en la página: ${timeSpent}</div>`;
}
actHtml += `<a href="${pUrl}" target="_blank" class="action-wrapper"><span class="dashicons ${dashiconClass}"></span><div class="m-tooltip-box">${tooltipInner}</div></a>`;
}
});
}
html += `
<div class="visitor-row">
<div class="v-line">
<b>${timeStr}</b> <span style="font-size:11px;color:#888">(${dateStr})</span>
<span class="v-icons" style="display:flex;align-items:center;gap:3px;">${flag}${browser}${os}</span>
<a href="${profileUrl}" target="_blank" class="profile-link dashicons dashicons-businessperson" title="Ver Perfil"></a>
</div>
<div class="v-line v-ref">${refHtml}</div>
<div class="v-line v-actions">${actHtml}</div>
</div>`;
});
} else {
html = '<div style="padding:20px;text-align:center;color:#999">Sin visitas recientes.</div>';
}
getEl('log-content').innerHTML = html;
status.innerText = 'En vivo (Actualizado: ' + new Date().toLocaleTimeString() + ')';
} catch (err) {
getEl('m-error').style.display = 'block';
getEl('m-error').innerText = 'Error: ' + err.message;
status.innerText = 'Error';
} finally {
dot.classList.remove('active');
}
}
fetchGraphData();
fetchRealTimeData();
setInterval(fetchRealTimeData, 10000);
getEl('btn-refresh-graph').addEventListener('click', function() { fetchGraphData(); });
})();
</script>
<?php
}
}4. Raksturlielumu kopsavilkums
100% JavaScript arhitektūra (klienta puse): atšķirībā no tradicionālajiem logrīkiem, kas datu pieprasīšanai izmanto PHP(cURL), šis logrīks izmanto JavaScript (fetch) tieši no jūsu pārlūkprogrammas.
- Priekšrocība? Jūsu WordPress serveris nedarbojas. Nav drošības slēdzenes, lai izsauktu sevi (Loopback), un nav lēna iekraušanas laika admin. Iekraušana ir asinhrona.
"Tīrs" reālais laiks (automātiska atjaunošana): logrīks automātiski atjauno skaitītājus un apmeklētāju žurnālu ik pēc 10 sekundēm. Varat atstāt cilni atvērtu un vērot, kā pieaug apmeklējumu skaits un skaitītāji, neko neskarot.
Gudra hibrīda grafika: Šis ir interesantākais tehniskais triks. Matomo parasti "arhivē" datus katru stundu, tāpēc šodienas grafiks bieži ir novecojis vai nulle. Šis logrīks apvieno divus datu avotus:
Rezultāts: 30 dienu diagramma, kurā "Šodien" punkts ir reāls un precīzs. Turklāt tam ir atsevišķa manuāla atsvaidzināšanas poga, lai API netiktu lieki pārblīvēts.
Dati par pēdējām 29 dienām: dati no vēsturiskā arhīva (ātra ielāde).
Šodien: to aprēķina reālajā laikā, API pieprasot minūtes, kas pagājušas no pusnakts līdz pašreizējai sekundei.


