Минуло більше двох років з тих пір, як я припинив використовувати Google Analytics і перейшов на Matomo On-Premise (на власному хостингу). І я такий щасливий.
Якщо ви використовуєте Matomo On-Premise, ви вже знаєте, що це потужний і повний інструмент, але необхідність відкривати нову вкладку кожного разу, коли ви хочете переглянути базову статистику, незручна і, можливо, навіть занадто вимоглива до вашого сервера, хоча він значно покращив свою продуктивність з моменту свого зародження, коли він називався Piwic, який з'їдав сервер в одну мить від запитів.
Існують плагіни інтеграції Matomo, але вони страждають від двох проблем: або вони відображають iframe, які заблоковані з міркувань безпеки, або вони роблять синхронні PHP-запити, які уповільнюють роботу адміністративної панелі.
Віджет підтягується з Matomo API
Я поставив собі за мету створити нативний віджет для робочого столу WordPress за допомогою Matomo API, який був би легким, естетичним і, перш за все, працював би в режимі реального часу, але при цьому не мав би жодного впливу на сервер і все працювало б у браузері клієнта. Для цього я покладався на документацію Matomo та допомогу Gemini 3.0, який значно покращився у своїй нещодавно випущеній версії з точки зору обробки коду, а також тому, що я не знаю, як написати більше трьох рядків, не зламавши нічого.
Попередження: віджет призначений для локального встановлення ( на тому ж сервері або на власному сервері), хоча, оскільки він написаний на JS, він також працюватиме, якщо ви встановили Matomo в іншому домені, якщо це дозволяє CORS (дозволи браузера).
Після пояснення його функцій і того, як його додати, ви знайдете повний код, щоб додати його до functions.php вашого шаблону, дочірньої теми або до плагіна сніппетів, а також вказати вашу URL-адресу, ідентифікатор проекту і токен Matomo Auth Token.
Основні дані в реальному часі
Оскільки мені не потрібно багато показників у віджеті, я налаштував його з трьома основними полями, які я регулярно перевіряю.
Перший - це онлайн лічильник відвідувачів, який автоматично оновлюється кожні десять секунд.
Нижче наведено два поля із загальною кількістю відвідувань за день, а праворуч - поле "Дії", також за день, яке, хоча Матомо називає його "Враження", насправді не зовсім точне, оскільки воно також додає інші дії, такі як відкриття зображення, пошук, запуск події кліку або перехід за посиланням на зовнішню URL-адресу. Обидва блоки працюють на основі 30-денних історичних даних, а також даних, що надходять у режимі реального часу.

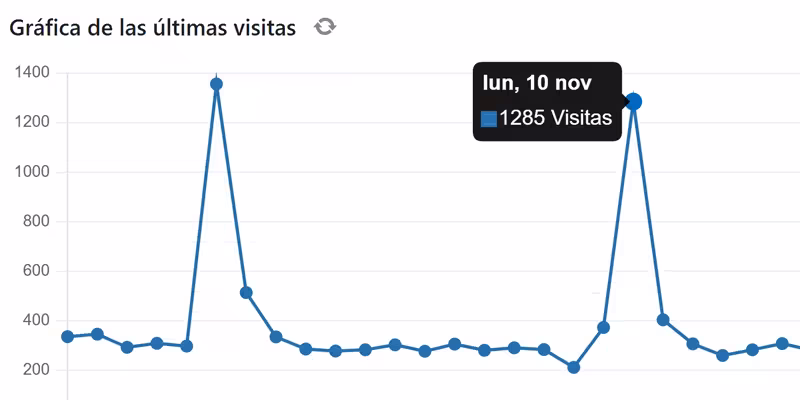
Графік відвідувань - це єдине поле, яке не оновлюється в режимі реального часу, оскільки немає сенсу робити зайві запити на дані, які вже є в полі "Відвідування (сьогодні)", а кнопка оновлення додана для того, щоб оновити графік в будь-який час один раз. Нижче наведено посилання для завантаження CSV-файлу або зображення графіка за останні 30 днів.
Для цієї діаграми ми використовуємо бібліотеку Chart.js, яка дозволяє малювати діаграму замість використання статичного зображення, дозволяючи взаємодіяти і бачити дані за день у точках.

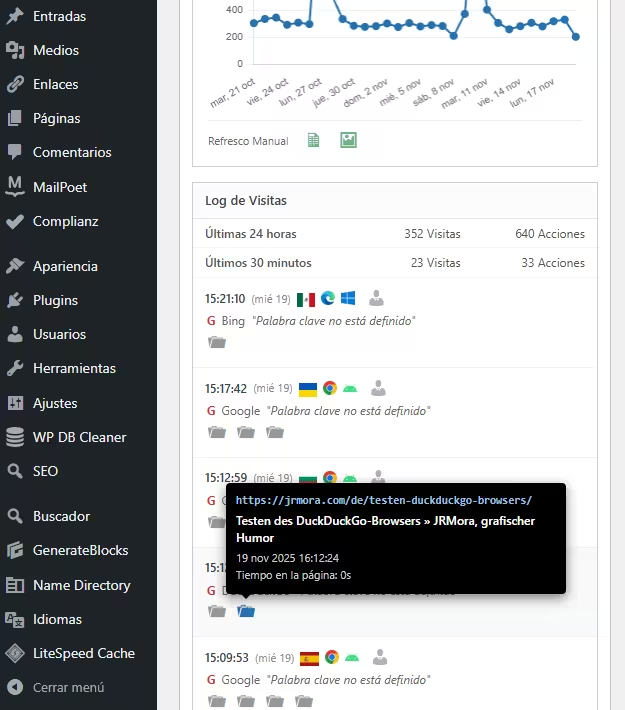
Четвертий блок - це детальний журнал відвідувачів, який показує: банери, браузери, операційні системи та посилання на звіт про профіль відвідувача. Всі дії представлені візуально з відповідними іконками для відвідувань, завантажень (зображень, pdf-файлів тощо), переходів за зовнішніми посиланнями, внутрішнього пошуку на сайті та подій.

Іконки мають"багаті" підказки у вигляді чорних ящиків, що імітують рідний стиль Matomo з усією необхідною інформацією.

Кроки, які необхідно зробити
1. Отримайте свій жетон Матомо
Вам потрібен "ключ", щоб ваш WordPress міг "спілкуватися" з вашим Matomo:
- Введіть свій Матомо.
- Перейдіть до Адміністрування (Gear) > Персонал > Безпека.
- Створіть новий маркер авторизації. Скопіюйте цей рядок символів. Одразу ж запишіть його і збережіть, тому що він буде показаний лише один раз, і якщо ви його втратите, вам доведеться створювати новий.
Ви повинні переконатися, що ті два поля, які з'являться, НЕ позначені, якщо вони позначені, зніміть їх, щоб вони були показані, як на зображенні:

2. Конфігурація
Після додавання коду до вашого functions.php просто відредагуйте ці три рядки в // --- CONFIGURATION ---, щоб додати ваші дані:
$matomo_url  = 'https://tu-dominio.com/matomo/'; // La URL donde tienes instalado Matomo
$id_site     = '1'; // El ID de tu sitio (suele ser 1)
$token_auth  = 'PEGA_AQUI_TU_TOKEN_DE_32_CARACTERES';
3. Код
/**
* Widget Matomo V25 - Dashboard Matomo Tiempo Real + Tooltip + Gráfica
*/
if ( ! function_exists( 'jrmora_widget_matomo_v25' ) ) {
function jrmora_widget_matomo_v25() {
wp_add_dashboard_widget(
'jrmora_matomo_widget_v25',
'Estadísticas Matomo (En Vivo)',
'jrmora_render_matomo_v25'
);
}
add_action( 'wp_dashboard_setup', 'jrmora_widget_matomo_v25' );
function jrmora_render_matomo_v25() {
// --- CONFIGURACIÓN ---
$matomo_url = 'https://tu-dominio.com/matomo/'; // La URL donde tienes instalado Matomo
$id_site = '1'; // El ID de tu sitio (suele ser 1)
$token_auth = 'PEGA_AQUI_TU_TOKEN_DE_32_CARACTERES';
// ---------------------
$export_csv = $matomo_url . "index.php?module=API&method=VisitsSummary.get&idSite=$id_site&period=day&date=last30&format=CSV&token_auth=$token_auth";
$export_img = $matomo_url . "index.php?module=API&method=ImageGraph.get&idSite=$id_site&apiModule=VisitsSummary&apiAction=get&token_auth=$token_auth&graphType=evolution&period=day&date=last30&width=800&height=400";
?>
<script src="https://cdn.jsdelivr.net/npm/chart.js"></script>
<style>
.matomo-js-wrapper { font-family: -apple-system, BlinkMacSystemFont, "Segoe UI", Roboto, sans-serif; position: relative; min-height: 250px; }
.status-bar { text-align: right; font-size: 11px; color: #888; margin-bottom: 10px; margin-top: -30px; }
.loading-dot { display: inline-block; width: 8px; height: 8px; background-color: #ccc; border-radius: 50%; margin-right: 5px; transition: background 0.3s; }
.loading-dot.active { background-color: #2271b1; box-shadow: 0 0 5px #2271b1; }
.hero-box { background: #fff; border: 1px solid #ccd0d4; border-left: 4px solid #2271b1; padding: 20px; text-align: center; margin-bottom: 15px; box-shadow: 0 1px 2px rgba(0,0,0,0.05); }
.hero-num { font-size: 64px; font-weight: 700; color: #1d2327; line-height: 1; display: block; margin-bottom: 5px; }
.hero-desc { font-size: 13px; color: #646970; }
.kpi-grid { display: flex; gap: 10px; margin-bottom: 15px; }
.kpi-card { background: #fff; border: 1px solid #ccd0d4; padding: 10px; flex: 1; text-align: center; }
.kpi-card h4 { margin: 0; font-size: 11px; color: #666; text-transform: uppercase; }
.kpi-card .val { font-size: 22px; font-weight: 600; color: #333; display: block; margin-top: 5px; }
/* GRAPH */
.graph-container { background: #fff; border: 1px solid #ccd0d4; margin-bottom: 15px; padding: 15px; position: relative; }
.graph-header { display: flex; justify-content: space-between; align-items: center; margin-bottom: 10px; }
.graph-title-area { display: flex; align-items: center; gap: 8px; }
.graph-title { font-size: 14px; font-weight: 600; color: #1d2327; }
.btn-graph-refresh { cursor: pointer; color: #888; font-size: 16px; display: flex; align-items: center; justify-content: center; width: 20px; height: 20px; border-radius: 50%; transition: all 0.3s; }
.btn-graph-refresh:hover { background: #f0f0f1; color: #2271b1; }
.btn-graph-refresh.spinning { animation: spin 1s linear infinite; color: #2271b1; }
@keyframes spin { 100% { transform: rotate(360deg); } }
.graph-legend { font-size: 11px; color: #2271b1; font-weight: 600; display: flex; align-items: center; gap: 5px; }
.graph-legend span { display: inline-block; width: 12px; height: 2px; background: #2271b1; }
.chart-canvas-box { position: relative; height: 250px; width: 100%; }
.graph-actions { display: flex; gap: 15px; padding-top: 10px; border-top: 1px solid #eee; margin-top: 5px; justify-content: flex-start; }
.action-icon { text-decoration: none; color: #2e8b57; font-size: 18px; opacity: 0.7; transition: opacity 0.2s; }
.action-icon:hover { opacity: 1; color: #1e7040; }
/* LOG */
.log-container { border: 1px solid #ccd0d4; background: #fff; }
.log-header { background: #fcfcfc; padding: 8px 12px; border-bottom: 1px solid #e5e5e5; font-weight: 600; font-size: 13px; }
.summary-table { width: 100%; font-size: 12px; border-collapse: collapse; border-bottom: 1px solid #eee; }
.summary-table td { padding: 6px 12px; border-bottom: 1px solid #f6f6f6; text-align: right; color: #555; }
.summary-table td:first-child { text-align: left; font-weight: 500; }
.visitor-row { padding: 10px 12px; border-bottom: 1px solid #f0f0f1; font-size: 12px; }
.visitor-row:hover { background: #f8f9fa; }
.v-line { display: flex; align-items: center; gap: 6px; margin-bottom: 4px; position: relative; }
.v-icons img { height: 14px; vertical-align: middle; margin-right: 3px; }
.v-ref { color: #666; margin-left: 2px; }
.v-actions { margin-top: 4px; margin-left: 2px; color: #888; display: flex; flex-wrap: wrap; gap: 4px; }
.error-box { color: red; padding: 20px; text-align: center; display: none; }
/* TOOLTIPS */
.m-tooltip-box { visibility: hidden; background-color: #000; color: #fff; text-align: left; border-radius: 4px; padding: 10px; position: absolute; z-index: 99999; bottom: 135%; opacity: 0; transition: opacity 0.2s; font-size: 11px; line-height: 1.4; box-shadow: 0 4px 12px rgba(0,0,0,0.5); pointer-events: none; white-space: normal; }
.m-tooltip-box::after { content: ""; position: absolute; top: 100%; left: 20px; margin-left: -5px; border-width: 5px; border-style: solid; border-color: #000 transparent transparent transparent; }
.flag-wrapper { position: relative; display: inline-block; cursor: help; }
.flag-wrapper .m-tooltip-box { width: 280px; left: 50%; margin-left: -20px; }
.flag-wrapper:hover .m-tooltip-box { visibility: visible; opacity: 1; }
.ft-row { display: block; margin-bottom: 2px; }
.ft-label { color: #aaa; font-weight: 400; margin-right: 4px; }
.ft-val { color: #fff; font-weight: 600; }
.action-wrapper { position: relative; display: inline-block; margin-right: 5px; text-decoration: none; }
.action-wrapper .m-tooltip-box { width: 320px; left: -10px; bottom: 140%; }
.action-wrapper:hover .m-tooltip-box { visibility: visible; opacity: 1; }
.at-url { color: #9ec2e6; font-weight: 600; word-break: break-all; margin-bottom: 4px; font-family: monospace; font-size: 11px; }
.at-title { color: #fff; font-weight: 600; margin-bottom: 4px; font-size: 12px; display: block; }
.at-meta { color: #ccc; display: block; margin-bottom: 2px; }
.profile-link { color: #b0b0b0; text-decoration: none; cursor: pointer; margin-left: 2px; }
.profile-link:hover { color: #2271b1; }
/* ICONOS DASHICONS UNIFICADOS */
.action-wrapper .dashicons { font-size: 18px; color: #999; transition: color 0.2s; }
.action-wrapper:hover .dashicons { color: #2271b1; cursor: pointer; }
</style>
<div class="status-bar"><span class="loading-dot" id="m-dot"></span> <span id="m-status">Conectando...</span></div>
<div class="matomo-js-wrapper">
<div id="m-error" class="error-box"></div>
<div class="hero-box">
<span class="hero-num" id="val-live">--</span>
<div class="hero-desc"><span id="val-live-vis">--</span> visitas y <span id="val-live-act">--</span> acciones (últimos 3 min)</div>
</div>
<div class="kpi-grid">
<div class="kpi-card"><h4>Visitas (Hoy)</h4><span class="val" id="val-uniq">--</span></div>
<div class="kpi-card"><h4>Acciones (Hoy)</h4><span class="val" id="val-page">--</span></div>
</div>
<div class="graph-container">
<div class="graph-header">
<div class="graph-title-area">
<span class="graph-title">Gráfica de las últimas visitas</span>
<span id="btn-refresh-graph" class="btn-graph-refresh dashicons dashicons-update" title="Actualizar Gráfica"></span>
</div>
<div class="graph-legend"><span></span> Visitas (Sesiones)</div>
</div>
<div class="chart-canvas-box">
<canvas id="matomoChart"></canvas>
</div>
<div class="graph-actions">
<span style="font-size:11px; color:#666; padding-top:2px;">Últimos 30 días</span>
<a href="<?php echo esc_url($export_csv); ?>" target="_blank" class="action-icon dashicons dashicons-media-spreadsheet" title="Exportar CSV"></a>
<a href="<?php echo esc_url($export_img); ?>" target="_blank" class="action-icon dashicons dashicons-format-image" title="Descargar Imagen"></a>
</div>
</div>
<div class="log-container">
<div class="log-header">Log de Visitas</div>
<table class="summary-table">
<tr><td>Últimas 24 horas</td><td id="val-24-v">--</td><td id="val-24-a">--</td></tr>
<tr><td>Últimos 30 minutos</td><td id="val-30-v">--</td><td id="val-30-a">--</td></tr>
</table>
<div class="log-rows" id="log-content">
<div style="padding:20px; text-align:center; color:#ccc;">Cargando...</div>
</div>
</div>
</div>
<script>
(function() {
const API_URL = "<?php echo $matomo_url; ?>";
const SITE_ID = "<?php echo $id_site; ?>";
const TOKEN = "<?php echo $token_auth; ?>";
const getEl = (id) => document.getElementById(id);
const buildUrl = (m, e = '') => `${API_URL}index.php?module=API&method=${m}&idSite=${SITE_ID}&format=JSON&token_auth=${TOKEN}${e}&random=${Date.now()}`;
const valOrUnk = (val) => (val && val !== '' && val !== '-' && val !== null) ? val : 'Desconocido';
function getMinutesSinceMidnight() {
const now = new Date();
const midnight = new Date(now.getFullYear(), now.getMonth(), now.getDate(), 0, 0, 0);
return Math.max(1, Math.floor((now - midnight) / 60000));
}
function getLocalDateStr() {
const d = new Date();
const year = d.getFullYear();
const month = String(d.getMonth() + 1).padStart(2, '0');
const day = String(d.getDate()).padStart(2, '0');
return `${year}-${month}-${day}`;
}
// --- GRÁFICA ---
let myChart = null;
async function fetchGraphData() {
const btn = getEl('btn-refresh-graph');
const ctx = document.getElementById('matomoChart');
if(!ctx) return;
btn.classList.add('spinning');
try {
const resHistory = await fetch(buildUrl('VisitsSummary.get', '&period=day&date=last30')).then(r => r.json());
const minsToday = getMinutesSinceMidnight();
const resLiveToday = await fetch(buildUrl('Live.getCounters', '&lastMinutes=' + minsToday)).then(r => r.json());
if(resHistory.result === 'error') throw new Error('Error Gráfica');
const labels = [];
const dataPoints = [];
const todayStr = getLocalDateStr();
const liveVal = (resLiveToday && resLiveToday[0] && resLiveToday[0].visits) ? resLiveToday[0].visits : 0;
for (const [dateStr, metrics] of Object.entries(resHistory)) {
const d = new Date(dateStr);
const prettyDate = d.toLocaleDateString('es-ES', {weekday:'short', day:'numeric', month:'short'});
labels.push(prettyDate);
if (dateStr === todayStr) dataPoints.push(liveVal);
else dataPoints.push((metrics && metrics.nb_visits) ? metrics.nb_visits : 0);
}
if (myChart) myChart.destroy();
myChart = new Chart(ctx, {
type: 'line',
data: {
labels: labels,
datasets: [{
label: 'Visitas',
data: dataPoints,
borderColor: '#2271b1',
backgroundColor: '#2271b1',
borderWidth: 2,
pointRadius: 3,
pointHoverRadius: 5,
pointBackgroundColor: '#2271b1',
tension: 0,
fill: false
}]
},
options: {
responsive: true,
maintainAspectRatio: false,
plugins: {
legend: { display: false },
tooltip: {
backgroundColor: 'rgba(0, 0, 0, 0.9)',
titleColor: '#fff',
bodyColor: '#fff',
titleFont: { size: 13, weight: 'bold' },
bodyFont: { size: 13 },
displayColors: true,
boxWidth: 8,
boxHeight: 8,
callbacks: { label: (c) => c.parsed.y + ' Visitas' }
}
},
scales: {
y: { beginAtZero: true, grid: { color: '#f0f0f1' }, ticks: { font: { size: 10 }, color: '#666' } },
x: { grid: { display: false }, ticks: { font: { size: 10 }, color: '#666', maxTicksLimit: 10 } }
}
}
});
} catch(e) { console.log("Error: " + e); } finally { btn.classList.remove('spinning'); }
}
// --- REAL TIME ---
async function fetchRealTimeData() {
const dot = getEl('m-dot');
const status = getEl('m-status');
try {
dot.classList.add('active');
status.innerText = 'Actualizando...';
const minsToday = getMinutesSinceMidnight();
const [res3m, res30m, resTodayLive, res24h, resLog] = await Promise.all([
fetch(buildUrl('Live.getCounters', '&lastMinutes=3')).then(r => r.json()),
fetch(buildUrl('Live.getCounters', '&lastMinutes=30')).then(r => r.json()),
fetch(buildUrl('Live.getCounters', '&lastMinutes=' + minsToday)).then(r => r.json()),
fetch(buildUrl('Live.getCounters', '&lastMinutes=1440')).then(r => r.json()),
fetch(buildUrl('Live.getLastVisitsDetails', '&filter_limit=10')).then(r => r.json())
]);
if(res3m.result === 'error') throw new Error(res3m.message);
const v3m = res3m[0]?.visits || 0;
getEl('val-live').innerText = v3m;
getEl('val-live-vis').innerText = v3m;
getEl('val-live-act').innerText = res3m[0]?.actions || 0;
getEl('val-uniq').innerText = resTodayLive[0]?.visits || 0;
getEl('val-page').innerText = resTodayLive[0]?.actions || 0;
getEl('val-24-v').innerText = (res24h[0]?.visits || 0) + ' Visitas';
getEl('val-24-a').innerText = (res24h[0]?.actions || 0) + ' Acciones';
getEl('val-30-v').innerText = (res30m[0]?.visits || 0) + ' Visitas';
getEl('val-30-a').innerText = (res30m[0]?.actions || 0) + ' Acciones';
let html = '';
if(resLog && resLog.length > 0) {
resLog.forEach(v => {
const fixUrl = (u) => u.startsWith('http') ? u : API_URL + u;
const tCountry = valOrUnk(v.countryPretty || v.country);
const tRegion = valOrUnk(v.region);
const tCity = valOrUnk(v.city);
const tIP = valOrUnk(v.visitIp);
const tID = valOrUnk(v.visitorId);
let rawLang = v.browserLanguage || v.languageCode;
let tLang = (rawLang && rawLang !== '-') ? 'Código de idioma ' + rawLang : 'Desconocido';
const flagTooltipHtml = `<div class="m-tooltip-box"><span class="ft-row"><span class="ft-label">País:</span> <span class="ft-val">${tCountry}</span></span><span class="ft-row"><span class="ft-label">Región:</span> <span class="ft-val">${tRegion}</span></span><span class="ft-row"><span class="ft-label">Ciudad:</span> <span class="ft-val">${tCity}</span></span><span class="ft-row"><span class="ft-label">Idioma:</span> <span class="ft-val">${tLang}</span></span><span class="ft-row"><span class="ft-label">IP:</span> <span class="ft-val">${tIP}</span></span><span class="ft-row"><span class="ft-label">ID:</span> <span class="ft-val">${tID}</span></span></div>`;
const flagImg = v.countryFlag ? `<img src="${fixUrl(v.countryFlag)}">` : '';
const flag = flagImg ? `<div class="flag-wrapper">${flagImg}${flagTooltipHtml}</div>` : '';
const date = new Date(v.serverTimestamp * 1000);
const timeStr = date.toLocaleTimeString([], {hour: '2-digit', minute:'2-digit', second:'2-digit'});
const dateStr = date.toLocaleDateString([], {weekday: 'short', day: 'numeric'});
const browser = v.browserIcon ? `<img src="${fixUrl(v.browserIcon)}" title="${v.browserName}">` : '';
const os = v.operatingSystemIcon ? `<img src="${fixUrl(v.operatingSystemIcon)}" title="${v.operatingSystemName}">` : '';
const profileUrl = `${API_URL}index.php?module=CoreHome&action=index&idSite=${SITE_ID}&period=day&date=today#?idSite=${SITE_ID}&period=day&date=today&category=Dashboard_Dashboard&subcategory=1&popover=visitorProfile%243A${v.visitorId}`;
let refHtml = 'Entrada directa';
if(v.referrerTypeName === 'Motores de búsqueda') {
refHtml = `<span style="color:#d63638;font-weight:bold">G</span> ${v.referrerName || ''}`;
if(v.referrerKeyword) refHtml += ` <i>"${v.referrerKeyword}"</i>`;
} else if(v.referrerTypeName === 'Sitios web') {
refHtml = `Ref: <a href="${v.referrerUrl}" target="_blank" style="color:#666">${v.referrerName}</a>`;
}
let actHtml = '';
if(v.actionDetails) {
v.actionDetails.forEach(a => {
if(a.type) {
let dashiconClass = 'dashicons-portfolio'; // Default
let isEvent = false;
let isSearch = false;
switch(a.type) {
case 'download': dashiconClass = 'dashicons-download'; break;
case 'outlink': dashiconClass = 'dashicons-external'; break;
case 'event': dashiconClass = 'dashicons-megaphone'; isEvent = true; break;
case 'search':
case 'siteSearch':
dashiconClass = 'dashicons-search';
isSearch = true;
break;
}
const pUrl = a.url || '#';
let actionDateStr = '';
if(a.timestamp) {
const ad = new Date(a.timestamp * 1000);
actionDateStr = ad.toLocaleDateString('es-ES', {day: 'numeric', month: 'short', year: 'numeric'}) + ' ' + ad.toLocaleTimeString();
}
let timeSpent = '0s';
if(a.timeSpent) {
const m = Math.floor(a.timeSpent / 60);
const s = a.timeSpent % 60;
timeSpent = (m > 0 ? m + 'm ' : '') + s + 's';
}
// CONSTRUCCIÓN TOOLTIP
let tooltipInner = '';
if (isEvent) {
let evText = `Evento ${a.eventCategory || ''} - ${a.eventAction || ''}`;
if(a.eventName) evText += ` - ${a.eventName}`;
if(a.pageTitle) evText += ` - ${a.pageTitle}`;
const evValue = (a.eventValue !== undefined) ? a.eventValue : '0';
evText += ` - ${evValue}`;
tooltipInner = `<div class="at-title">${evText}</div><div class="at-meta">${actionDateStr}</div>`;
} else if (isSearch) {
// Lógica Búsqueda Interna
const keyword = a.siteSearchKeyword || a.actionName || 'Sin palabras clave';
tooltipInner = `<div class="at-title">Búsqueda interna: ${keyword}</div><div class="at-meta">${actionDateStr}</div>`;
} else {
// Lógica Estándar
const pTitle = (a.pageTitle || 'Título desconocido').replace(/"/g, '"');
tooltipInner = `<div class="at-url">${pUrl}</div><div class="at-title">${pTitle}</div><div class="at-meta">${actionDateStr}</div><div class="at-meta">Tiempo en la página: ${timeSpent}</div>`;
}
actHtml += `<a href="${pUrl}" target="_blank" class="action-wrapper"><span class="dashicons ${dashiconClass}"></span><div class="m-tooltip-box">${tooltipInner}</div></a>`;
}
});
}
html += `
<div class="visitor-row">
<div class="v-line">
<b>${timeStr}</b> <span style="font-size:11px;color:#888">(${dateStr})</span>
<span class="v-icons" style="display:flex;align-items:center;gap:3px;">${flag}${browser}${os}</span>
<a href="${profileUrl}" target="_blank" class="profile-link dashicons dashicons-businessperson" title="Ver Perfil"></a>
</div>
<div class="v-line v-ref">${refHtml}</div>
<div class="v-line v-actions">${actHtml}</div>
</div>`;
});
} else {
html = '<div style="padding:20px;text-align:center;color:#999">Sin visitas recientes.</div>';
}
getEl('log-content').innerHTML = html;
status.innerText = 'En vivo (Actualizado: ' + new Date().toLocaleTimeString() + ')';
} catch (err) {
getEl('m-error').style.display = 'block';
getEl('m-error').innerText = 'Error: ' + err.message;
status.innerText = 'Error';
} finally {
dot.classList.remove('active');
}
}
fetchGraphData();
fetchRealTimeData();
setInterval(fetchRealTimeData, 10000);
getEl('btn-refresh-graph').addEventListener('click', function() { fetchGraphData(); });
})();
</script>
<?php
}
}4. Короткий огляд характеристик
100% JavaScript архітектура (на стороні клієнта): На відміну від традиційних віджетів, які використовують PHP(cURL) для запиту даних, цей віджет використовує JavaScript (fetch ) безпосередньо з вашого браузера .
- Перевага? Ваш сервер WordPress не працює. Немає блокування виклику самого себе (Loopback) і повільного завантаження в адмінці. Завантаження відбувається асинхронно.
Чистий" реальний час (Auto-Refresh): віджет автоматично оновлює лічильники та журнал відвідувань кожні 10 секунд. Ви можете залишити вкладку відкритою і спостерігати за надходженням відвідувань і зростанням лічильників, нічого не торкаючись.
Розумна гібридна графіка: Ось найцікавіший технічний трюк. Matomo зазвичай "архівує" дані щогодини, тому сьогоднішній графік часто буває застарілим або нульовим. Цей віджет поєднує два джерела даних:
Результат: 30-денний графік, де точка "Сьогодні" є реальною і точною. Крім того, він має окрему кнопку ручного оновлення, щоб не захаращувати API без потреби.
Дані за останні 29 днів: Дані з історичного архіву (швидке завантаження).
Сьогодні: обчислюється в реальному часі шляхом запиту до API хвилин, що минули з опівночі до поточної секунди.


