It's been more than two years since I stopped using Google Analytics and made the move to Matomo On-Premise (self-hosted). And so happy.
If you use Matomo On-Premise, you already know that it is a powerful and complete tool, but having to open a new tab every time you want to see the basic statistics is uncomfortable and maybe even too demanding on your server, although it has improved a lot in performance since its beginnings, when it was called Piwic, which ate up the server at the drop of a hat with requests.
There are Matomo integration plugins, but they tend to suffer from two problems: either they display iframes that are blocked for security reasons, or they make synchronous PHP requests that slow down the administration panel.
Widget pulling from the Matomo API
I set out to create a native widget for the WordPress desktop using the Matomo API that was light, aesthetic and, above all, real-time, but that had zero impact on the server and that everything ran in the client's browser. For this I relied on Matomo 's documentation and the help of Gemini 3.0, which has improved a lot in its recently released version in terms of code treatment.
Warning: the widget is designed for On-Premise installations (same server or own server), although as it is JS it would also work if you have Matomo in another domain, as long as the CORS (browser permissions) allows it.
After the explanation of its functions and how to add it, you will find the complete code just for you to add it to the functions.php of your template, child theme or with your snippets plugin and include your URL, your project ID and the Matomo Auth Token.
Basic real-time data
As I don't need a lot of metrics in the dashboard, I set it up with the three basic boxes that I routinely consult.
The first is the online visitor counter, which is automatically updated every ten seconds.
Below are two boxes, with the total number of visits for the day and to the right the "Actions" box, also for the day, which although Matomo calls it "Impressions" is actually not quite accurate because it also adds other actions such as opening an image, doing a search, triggering a click event or clicking on a link to an external URL. Both boxes are powered by 30 days of historical data plus real-time data injection.

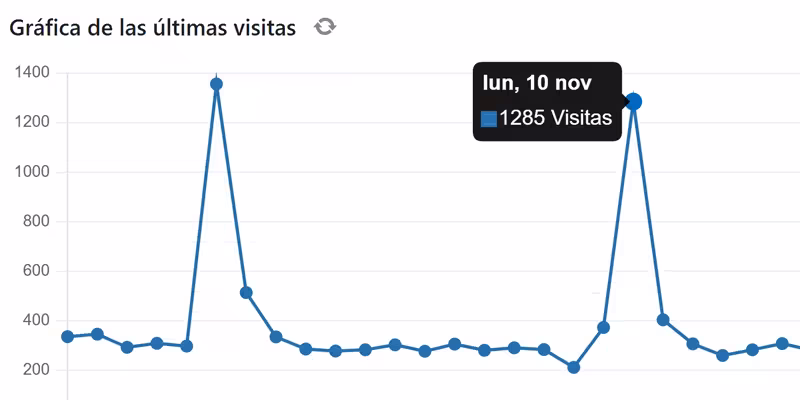
The visits graph is the only box that is not updated in real time because it doesn't make much sense to force unnecessary requests for a data that we already have in the "Visits (today)" box and a refresh button is added to refresh the graph at any time just once. Below is a link to download a CSV or an image of the graph for the last 30 days.
For this chart we use the Chart.js library, which allows the chart to be drawn instead of using a static image, allowing interaction and being able to see the data per day at the points.

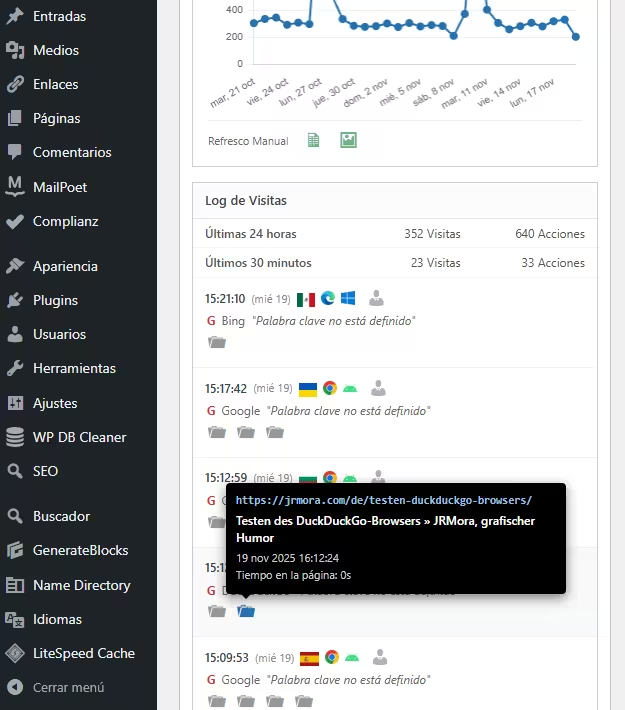
The fourth box is the detailed visitor log showing: banners, browsers, operating systems and a link to the native visitor profile report. All actions are represented visually with corresponding icons for visits, downloads (of images or pdfs or whatever), clicks on external links, internal site searches and events.

The icons have"rich" tooltips in the form of black boxes imitating the native Matomo style with all the minimum relevant info.

Steps to be taken
1. Get your Matomo token
You need a "key" so that your WordPress can "communicate" with your Matomo:
- Enter your Matomo.
- Go to Administration (Gear) > Personnel > Security.
- Create a new Auth Token. Copy that string of characters. Write it down right away and save it because it will only show it once and if you lose it you will have to create a new one.
You must make sure that those two boxes that appear are NOT checked, if they are, uncheck them so that they are shown as in the image:

2. Configuration
After adding the code to your functions.php, just edit these three lines in // --- CONFIGURATION --- to add your data:
$matomo_url  = 'https://tu-dominio.com/matomo/'; // La URL donde tienes instalado Matomo
$id_site     = '1'; // El ID de tu sitio (suele ser 1)
$token_auth  = 'PEGA_AQUI_TU_TOKEN_DE_32_CARACTERES';
3. Code
/**
* Widget Matomo V25 - Dashboard Matomo Tiempo Real + Tooltip + Gráfica
*/
if ( ! function_exists( 'jrmora_widget_matomo_v25' ) ) {
function jrmora_widget_matomo_v25() {
wp_add_dashboard_widget(
'jrmora_matomo_widget_v25',
'Estadísticas Matomo (En Vivo)',
'jrmora_render_matomo_v25'
);
}
add_action( 'wp_dashboard_setup', 'jrmora_widget_matomo_v25' );
function jrmora_render_matomo_v25() {
// --- CONFIGURACIÓN ---
$matomo_url = 'https://tu-dominio.com/matomo/'; // La URL donde tienes instalado Matomo
$id_site = '1'; // El ID de tu sitio (suele ser 1)
$token_auth = 'PEGA_AQUI_TU_TOKEN_DE_32_CARACTERES';
// ---------------------
$export_csv = $matomo_url . "index.php?module=API&method=VisitsSummary.get&idSite=$id_site&period=day&date=last30&format=CSV&token_auth=$token_auth";
$export_img = $matomo_url . "index.php?module=API&method=ImageGraph.get&idSite=$id_site&apiModule=VisitsSummary&apiAction=get&token_auth=$token_auth&graphType=evolution&period=day&date=last30&width=800&height=400";
?>
<script src="https://cdn.jsdelivr.net/npm/chart.js"></script>
<style>
.matomo-js-wrapper { font-family: -apple-system, BlinkMacSystemFont, "Segoe UI", Roboto, sans-serif; position: relative; min-height: 250px; }
.status-bar { text-align: right; font-size: 11px; color: #888; margin-bottom: 10px; margin-top: -30px; }
.loading-dot { display: inline-block; width: 8px; height: 8px; background-color: #ccc; border-radius: 50%; margin-right: 5px; transition: background 0.3s; }
.loading-dot.active { background-color: #2271b1; box-shadow: 0 0 5px #2271b1; }
.hero-box { background: #fff; border: 1px solid #ccd0d4; border-left: 4px solid #2271b1; padding: 20px; text-align: center; margin-bottom: 15px; box-shadow: 0 1px 2px rgba(0,0,0,0.05); }
.hero-num { font-size: 64px; font-weight: 700; color: #1d2327; line-height: 1; display: block; margin-bottom: 5px; }
.hero-desc { font-size: 13px; color: #646970; }
.kpi-grid { display: flex; gap: 10px; margin-bottom: 15px; }
.kpi-card { background: #fff; border: 1px solid #ccd0d4; padding: 10px; flex: 1; text-align: center; }
.kpi-card h4 { margin: 0; font-size: 11px; color: #666; text-transform: uppercase; }
.kpi-card .val { font-size: 22px; font-weight: 600; color: #333; display: block; margin-top: 5px; }
/* GRAPH */
.graph-container { background: #fff; border: 1px solid #ccd0d4; margin-bottom: 15px; padding: 15px; position: relative; }
.graph-header { display: flex; justify-content: space-between; align-items: center; margin-bottom: 10px; }
.graph-title-area { display: flex; align-items: center; gap: 8px; }
.graph-title { font-size: 14px; font-weight: 600; color: #1d2327; }
.btn-graph-refresh { cursor: pointer; color: #888; font-size: 16px; display: flex; align-items: center; justify-content: center; width: 20px; height: 20px; border-radius: 50%; transition: all 0.3s; }
.btn-graph-refresh:hover { background: #f0f0f1; color: #2271b1; }
.btn-graph-refresh.spinning { animation: spin 1s linear infinite; color: #2271b1; }
@keyframes spin { 100% { transform: rotate(360deg); } }
.graph-legend { font-size: 11px; color: #2271b1; font-weight: 600; display: flex; align-items: center; gap: 5px; }
.graph-legend span { display: inline-block; width: 12px; height: 2px; background: #2271b1; }
.chart-canvas-box { position: relative; height: 250px; width: 100%; }
.graph-actions { display: flex; gap: 15px; padding-top: 10px; border-top: 1px solid #eee; margin-top: 5px; justify-content: flex-start; }
.action-icon { text-decoration: none; color: #2e8b57; font-size: 18px; opacity: 0.7; transition: opacity 0.2s; }
.action-icon:hover { opacity: 1; color: #1e7040; }
/* LOG */
.log-container { border: 1px solid #ccd0d4; background: #fff; }
.log-header { background: #fcfcfc; padding: 8px 12px; border-bottom: 1px solid #e5e5e5; font-weight: 600; font-size: 13px; }
.summary-table { width: 100%; font-size: 12px; border-collapse: collapse; border-bottom: 1px solid #eee; }
.summary-table td { padding: 6px 12px; border-bottom: 1px solid #f6f6f6; text-align: right; color: #555; }
.summary-table td:first-child { text-align: left; font-weight: 500; }
.visitor-row { padding: 10px 12px; border-bottom: 1px solid #f0f0f1; font-size: 12px; }
.visitor-row:hover { background: #f8f9fa; }
.v-line { display: flex; align-items: center; gap: 6px; margin-bottom: 4px; position: relative; }
.v-icons img { height: 14px; vertical-align: middle; margin-right: 3px; }
.v-ref { color: #666; margin-left: 2px; }
.v-actions { margin-top: 4px; margin-left: 2px; color: #888; display: flex; flex-wrap: wrap; gap: 4px; }
.error-box { color: red; padding: 20px; text-align: center; display: none; }
/* TOOLTIPS */
.m-tooltip-box { visibility: hidden; background-color: #000; color: #fff; text-align: left; border-radius: 4px; padding: 10px; position: absolute; z-index: 99999; bottom: 135%; opacity: 0; transition: opacity 0.2s; font-size: 11px; line-height: 1.4; box-shadow: 0 4px 12px rgba(0,0,0,0.5); pointer-events: none; white-space: normal; }
.m-tooltip-box::after { content: ""; position: absolute; top: 100%; left: 20px; margin-left: -5px; border-width: 5px; border-style: solid; border-color: #000 transparent transparent transparent; }
.flag-wrapper { position: relative; display: inline-block; cursor: help; }
.flag-wrapper .m-tooltip-box { width: 280px; left: 50%; margin-left: -20px; }
.flag-wrapper:hover .m-tooltip-box { visibility: visible; opacity: 1; }
.ft-row { display: block; margin-bottom: 2px; }
.ft-label { color: #aaa; font-weight: 400; margin-right: 4px; }
.ft-val { color: #fff; font-weight: 600; }
.action-wrapper { position: relative; display: inline-block; margin-right: 5px; text-decoration: none; }
.action-wrapper .m-tooltip-box { width: 320px; left: -10px; bottom: 140%; }
.action-wrapper:hover .m-tooltip-box { visibility: visible; opacity: 1; }
.at-url { color: #9ec2e6; font-weight: 600; word-break: break-all; margin-bottom: 4px; font-family: monospace; font-size: 11px; }
.at-title { color: #fff; font-weight: 600; margin-bottom: 4px; font-size: 12px; display: block; }
.at-meta { color: #ccc; display: block; margin-bottom: 2px; }
.profile-link { color: #b0b0b0; text-decoration: none; cursor: pointer; margin-left: 2px; }
.profile-link:hover { color: #2271b1; }
/* ICONOS DASHICONS UNIFICADOS */
.action-wrapper .dashicons { font-size: 18px; color: #999; transition: color 0.2s; }
.action-wrapper:hover .dashicons { color: #2271b1; cursor: pointer; }
</style>
<div class="status-bar"><span class="loading-dot" id="m-dot"></span> <span id="m-status">Conectando...</span></div>
<div class="matomo-js-wrapper">
<div id="m-error" class="error-box"></div>
<div class="hero-box">
<span class="hero-num" id="val-live">--</span>
<div class="hero-desc"><span id="val-live-vis">--</span> visitas y <span id="val-live-act">--</span> acciones (últimos 3 min)</div>
</div>
<div class="kpi-grid">
<div class="kpi-card"><h4>Visitas (Hoy)</h4><span class="val" id="val-uniq">--</span></div>
<div class="kpi-card"><h4>Acciones (Hoy)</h4><span class="val" id="val-page">--</span></div>
</div>
<div class="graph-container">
<div class="graph-header">
<div class="graph-title-area">
<span class="graph-title">Gráfica de las últimas visitas</span>
<span id="btn-refresh-graph" class="btn-graph-refresh dashicons dashicons-update" title="Actualizar Gráfica"></span>
</div>
<div class="graph-legend"><span></span> Visitas (Sesiones)</div>
</div>
<div class="chart-canvas-box">
<canvas id="matomoChart"></canvas>
</div>
<div class="graph-actions">
<span style="font-size:11px; color:#666; padding-top:2px;">Últimos 30 días</span>
<a href="<?php echo esc_url($export_csv); ?>" target="_blank" class="action-icon dashicons dashicons-media-spreadsheet" title="Exportar CSV"></a>
<a href="<?php echo esc_url($export_img); ?>" target="_blank" class="action-icon dashicons dashicons-format-image" title="Descargar Imagen"></a>
</div>
</div>
<div class="log-container">
<div class="log-header">Log de Visitas</div>
<table class="summary-table">
<tr><td>Últimas 24 horas</td><td id="val-24-v">--</td><td id="val-24-a">--</td></tr>
<tr><td>Últimos 30 minutos</td><td id="val-30-v">--</td><td id="val-30-a">--</td></tr>
</table>
<div class="log-rows" id="log-content">
<div style="padding:20px; text-align:center; color:#ccc;">Cargando...</div>
</div>
</div>
</div>
<script>
(function() {
const API_URL = "<?php echo $matomo_url; ?>";
const SITE_ID = "<?php echo $id_site; ?>";
const TOKEN = "<?php echo $token_auth; ?>";
const getEl = (id) => document.getElementById(id);
const buildUrl = (m, e = '') => `${API_URL}index.php?module=API&method=${m}&idSite=${SITE_ID}&format=JSON&token_auth=${TOKEN}${e}&random=${Date.now()}`;
const valOrUnk = (val) => (val && val !== '' && val !== '-' && val !== null) ? val : 'Desconocido';
function getMinutesSinceMidnight() {
const now = new Date();
const midnight = new Date(now.getFullYear(), now.getMonth(), now.getDate(), 0, 0, 0);
return Math.max(1, Math.floor((now - midnight) / 60000));
}
function getLocalDateStr() {
const d = new Date();
const year = d.getFullYear();
const month = String(d.getMonth() + 1).padStart(2, '0');
const day = String(d.getDate()).padStart(2, '0');
return `${year}-${month}-${day}`;
}
// --- GRÁFICA ---
let myChart = null;
async function fetchGraphData() {
const btn = getEl('btn-refresh-graph');
const ctx = document.getElementById('matomoChart');
if(!ctx) return;
btn.classList.add('spinning');
try {
const resHistory = await fetch(buildUrl('VisitsSummary.get', '&period=day&date=last30')).then(r => r.json());
const minsToday = getMinutesSinceMidnight();
const resLiveToday = await fetch(buildUrl('Live.getCounters', '&lastMinutes=' + minsToday)).then(r => r.json());
if(resHistory.result === 'error') throw new Error('Error Gráfica');
const labels = [];
const dataPoints = [];
const todayStr = getLocalDateStr();
const liveVal = (resLiveToday && resLiveToday[0] && resLiveToday[0].visits) ? resLiveToday[0].visits : 0;
for (const [dateStr, metrics] of Object.entries(resHistory)) {
const d = new Date(dateStr);
const prettyDate = d.toLocaleDateString('es-ES', {weekday:'short', day:'numeric', month:'short'});
labels.push(prettyDate);
if (dateStr === todayStr) dataPoints.push(liveVal);
else dataPoints.push((metrics && metrics.nb_visits) ? metrics.nb_visits : 0);
}
if (myChart) myChart.destroy();
myChart = new Chart(ctx, {
type: 'line',
data: {
labels: labels,
datasets: [{
label: 'Visitas',
data: dataPoints,
borderColor: '#2271b1',
backgroundColor: '#2271b1',
borderWidth: 2,
pointRadius: 3,
pointHoverRadius: 5,
pointBackgroundColor: '#2271b1',
tension: 0,
fill: false
}]
},
options: {
responsive: true,
maintainAspectRatio: false,
plugins: {
legend: { display: false },
tooltip: {
backgroundColor: 'rgba(0, 0, 0, 0.9)',
titleColor: '#fff',
bodyColor: '#fff',
titleFont: { size: 13, weight: 'bold' },
bodyFont: { size: 13 },
displayColors: true,
boxWidth: 8,
boxHeight: 8,
callbacks: { label: (c) => c.parsed.y + ' Visitas' }
}
},
scales: {
y: { beginAtZero: true, grid: { color: '#f0f0f1' }, ticks: { font: { size: 10 }, color: '#666' } },
x: { grid: { display: false }, ticks: { font: { size: 10 }, color: '#666', maxTicksLimit: 10 } }
}
}
});
} catch(e) { console.log("Error: " + e); } finally { btn.classList.remove('spinning'); }
}
// --- REAL TIME ---
async function fetchRealTimeData() {
const dot = getEl('m-dot');
const status = getEl('m-status');
try {
dot.classList.add('active');
status.innerText = 'Actualizando...';
const minsToday = getMinutesSinceMidnight();
const [res3m, res30m, resTodayLive, res24h, resLog] = await Promise.all([
fetch(buildUrl('Live.getCounters', '&lastMinutes=3')).then(r => r.json()),
fetch(buildUrl('Live.getCounters', '&lastMinutes=30')).then(r => r.json()),
fetch(buildUrl('Live.getCounters', '&lastMinutes=' + minsToday)).then(r => r.json()),
fetch(buildUrl('Live.getCounters', '&lastMinutes=1440')).then(r => r.json()),
fetch(buildUrl('Live.getLastVisitsDetails', '&filter_limit=10')).then(r => r.json())
]);
if(res3m.result === 'error') throw new Error(res3m.message);
const v3m = res3m[0]?.visits || 0;
getEl('val-live').innerText = v3m;
getEl('val-live-vis').innerText = v3m;
getEl('val-live-act').innerText = res3m[0]?.actions || 0;
getEl('val-uniq').innerText = resTodayLive[0]?.visits || 0;
getEl('val-page').innerText = resTodayLive[0]?.actions || 0;
getEl('val-24-v').innerText = (res24h[0]?.visits || 0) + ' Visitas';
getEl('val-24-a').innerText = (res24h[0]?.actions || 0) + ' Acciones';
getEl('val-30-v').innerText = (res30m[0]?.visits || 0) + ' Visitas';
getEl('val-30-a').innerText = (res30m[0]?.actions || 0) + ' Acciones';
let html = '';
if(resLog && resLog.length > 0) {
resLog.forEach(v => {
const fixUrl = (u) => u.startsWith('http') ? u : API_URL + u;
const tCountry = valOrUnk(v.countryPretty || v.country);
const tRegion = valOrUnk(v.region);
const tCity = valOrUnk(v.city);
const tIP = valOrUnk(v.visitIp);
const tID = valOrUnk(v.visitorId);
let rawLang = v.browserLanguage || v.languageCode;
let tLang = (rawLang && rawLang !== '-') ? 'Código de idioma ' + rawLang : 'Desconocido';
const flagTooltipHtml = `<div class="m-tooltip-box"><span class="ft-row"><span class="ft-label">País:</span> <span class="ft-val">${tCountry}</span></span><span class="ft-row"><span class="ft-label">Región:</span> <span class="ft-val">${tRegion}</span></span><span class="ft-row"><span class="ft-label">Ciudad:</span> <span class="ft-val">${tCity}</span></span><span class="ft-row"><span class="ft-label">Idioma:</span> <span class="ft-val">${tLang}</span></span><span class="ft-row"><span class="ft-label">IP:</span> <span class="ft-val">${tIP}</span></span><span class="ft-row"><span class="ft-label">ID:</span> <span class="ft-val">${tID}</span></span></div>`;
const flagImg = v.countryFlag ? `<img src="${fixUrl(v.countryFlag)}">` : '';
const flag = flagImg ? `<div class="flag-wrapper">${flagImg}${flagTooltipHtml}</div>` : '';
const date = new Date(v.serverTimestamp * 1000);
const timeStr = date.toLocaleTimeString([], {hour: '2-digit', minute:'2-digit', second:'2-digit'});
const dateStr = date.toLocaleDateString([], {weekday: 'short', day: 'numeric'});
const browser = v.browserIcon ? `<img src="${fixUrl(v.browserIcon)}" title="${v.browserName}">` : '';
const os = v.operatingSystemIcon ? `<img src="${fixUrl(v.operatingSystemIcon)}" title="${v.operatingSystemName}">` : '';
const profileUrl = `${API_URL}index.php?module=CoreHome&action=index&idSite=${SITE_ID}&period=day&date=today#?idSite=${SITE_ID}&period=day&date=today&category=Dashboard_Dashboard&subcategory=1&popover=visitorProfile%243A${v.visitorId}`;
let refHtml = 'Entrada directa';
if(v.referrerTypeName === 'Motores de búsqueda') {
refHtml = `<span style="color:#d63638;font-weight:bold">G</span> ${v.referrerName || ''}`;
if(v.referrerKeyword) refHtml += ` <i>"${v.referrerKeyword}"</i>`;
} else if(v.referrerTypeName === 'Sitios web') {
refHtml = `Ref: <a href="${v.referrerUrl}" target="_blank" style="color:#666">${v.referrerName}</a>`;
}
let actHtml = '';
if(v.actionDetails) {
v.actionDetails.forEach(a => {
if(a.type) {
let dashiconClass = 'dashicons-portfolio'; // Default
let isEvent = false;
let isSearch = false;
switch(a.type) {
case 'download': dashiconClass = 'dashicons-download'; break;
case 'outlink': dashiconClass = 'dashicons-external'; break;
case 'event': dashiconClass = 'dashicons-megaphone'; isEvent = true; break;
case 'search':
case 'siteSearch':
dashiconClass = 'dashicons-search';
isSearch = true;
break;
}
const pUrl = a.url || '#';
let actionDateStr = '';
if(a.timestamp) {
const ad = new Date(a.timestamp * 1000);
actionDateStr = ad.toLocaleDateString('es-ES', {day: 'numeric', month: 'short', year: 'numeric'}) + ' ' + ad.toLocaleTimeString();
}
let timeSpent = '0s';
if(a.timeSpent) {
const m = Math.floor(a.timeSpent / 60);
const s = a.timeSpent % 60;
timeSpent = (m > 0 ? m + 'm ' : '') + s + 's';
}
// CONSTRUCCIÓN TOOLTIP
let tooltipInner = '';
if (isEvent) {
let evText = `Evento ${a.eventCategory || ''} - ${a.eventAction || ''}`;
if(a.eventName) evText += ` - ${a.eventName}`;
if(a.pageTitle) evText += ` - ${a.pageTitle}`;
const evValue = (a.eventValue !== undefined) ? a.eventValue : '0';
evText += ` - ${evValue}`;
tooltipInner = `<div class="at-title">${evText}</div><div class="at-meta">${actionDateStr}</div>`;
} else if (isSearch) {
// Lógica Búsqueda Interna
const keyword = a.siteSearchKeyword || a.actionName || 'Sin palabras clave';
tooltipInner = `<div class="at-title">Búsqueda interna: ${keyword}</div><div class="at-meta">${actionDateStr}</div>`;
} else {
// Lógica Estándar
const pTitle = (a.pageTitle || 'Título desconocido').replace(/"/g, '"');
tooltipInner = `<div class="at-url">${pUrl}</div><div class="at-title">${pTitle}</div><div class="at-meta">${actionDateStr}</div><div class="at-meta">Tiempo en la página: ${timeSpent}</div>`;
}
actHtml += `<a href="${pUrl}" target="_blank" class="action-wrapper"><span class="dashicons ${dashiconClass}"></span><div class="m-tooltip-box">${tooltipInner}</div></a>`;
}
});
}
html += `
<div class="visitor-row">
<div class="v-line">
<b>${timeStr}</b> <span style="font-size:11px;color:#888">(${dateStr})</span>
<span class="v-icons" style="display:flex;align-items:center;gap:3px;">${flag}${browser}${os}</span>
<a href="${profileUrl}" target="_blank" class="profile-link dashicons dashicons-businessperson" title="Ver Perfil"></a>
</div>
<div class="v-line v-ref">${refHtml}</div>
<div class="v-line v-actions">${actHtml}</div>
</div>`;
});
} else {
html = '<div style="padding:20px;text-align:center;color:#999">Sin visitas recientes.</div>';
}
getEl('log-content').innerHTML = html;
status.innerText = 'En vivo (Actualizado: ' + new Date().toLocaleTimeString() + ')';
} catch (err) {
getEl('m-error').style.display = 'block';
getEl('m-error').innerText = 'Error: ' + err.message;
status.innerText = 'Error';
} finally {
dot.classList.remove('active');
}
}
fetchGraphData();
fetchRealTimeData();
setInterval(fetchRealTimeData, 10000);
getEl('btn-refresh-graph').addEventListener('click', function() { fetchGraphData(); });
})();
</script>
<?php
}
}4. Summary of characteristics
100% JavaScript architecture (Client-Side): Unlike traditional widgets that use PHP(cURL) to request data, this widget uses JavaScript (fetch) directly from your browser .
- The advantage? Your WordPress server doesn't work. There are no security locks for calling itself (Loopback) and no slow loading times in the admin. The loading is asynchronous.
Pure" real time (Auto-Refresh): The widget automatically refreshes the counters and visitor log every 10 seconds. You can leave the tab open and watch the visits come in and the counters go up without touching anything.
Smart hybrid graphics: Here's the most interesting technical trick. Matomo usually "archives" data every hour, so today's chart is often outdated or zero. This widget combines two data sources:
Result: A 30-day chart where the "Today" point is real and accurate. In addition, it has a separate manual refresh button so that the API is not cluttered unnecessarily.
Data for the last 29 days: Data from the historical archive (fast loading).
Today: This is calculated in real time by asking the API for the minutes elapsed from midnight to the current second.


