Some WordPress site administrators are obsessed with PageSpeed Insights or GTmetrix. My advice, and that of many others who know much more about it, is that you shouldn't give those metrics more importance than they have.
If the perceived loading speed is good, it is not necessary to put everything "in green". In many cases it is even counterproductive because you can fall into over-optimisation, or worse, you can end up ruining different things trying to fix one thing.
Still, whether you're a WPO aficionado, an optimisation enthusiast or just want to try to improve your site's responsiveness, these tools are almost essential. The problem is that they offer "still pictures" taken from external servers. But what happens when you, as an administrator, browse your site, what about those ads that load late or that menu that jumps just when you're about to click?
Origin
Speed Auditor was born as a response to a personal need to have several simple but powerful local diagnostic tools. It's not an optimisation plugin (it doesn't change anything in your code), it's a real-time auditing plugin.
If you are looking for a good, possibly the best, paid plugin for WPO, with which to make changes and fine tuning, take a look at Perfmatters. If, on the other hand, you are looking for something free and simple, without getting your head in a twist with settings and adjustments, but with a lot of possibilities, you can try WPO Rocket Tweaks by Fernando Tellado, available in the WordPress repository.
If you don't know what a DOM node or latency metric is, don't worry. Speed Auditor is designed to help you understand your website at a glance:
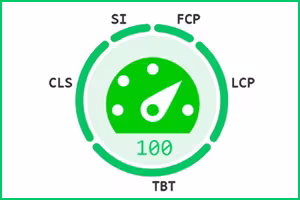
- The smart indicator: A colour-changing icon will appear in your admin bar. If it is Green, your LCP (the time it takes to see the most important things) is optimal. If it turns Orange or Red, something needs your attention.
- Audit while you browse: You don't have to configure anything complex. You activate the plugin and, while you check your posts, it works in the background analysing if your images are too heavy or if your server is responding sluggishly.
- More human reports: With one click, download a .txt file that you can send to your developer or save to compare results after applying changes.
Under the bonnet
Version 1.1.8 attempts to provide some depth of diagnostics to save fiddling time in the browser console.
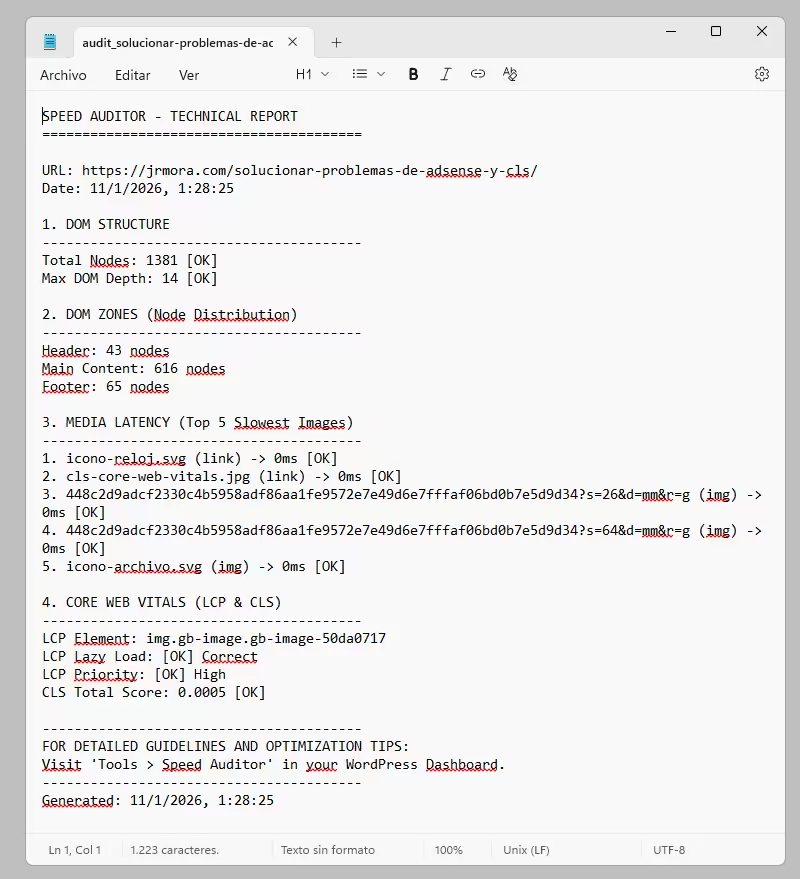
- Precise LCP identification: The plugin detects exactly which element (image or text block) triggered the Largest Contentful Paint.
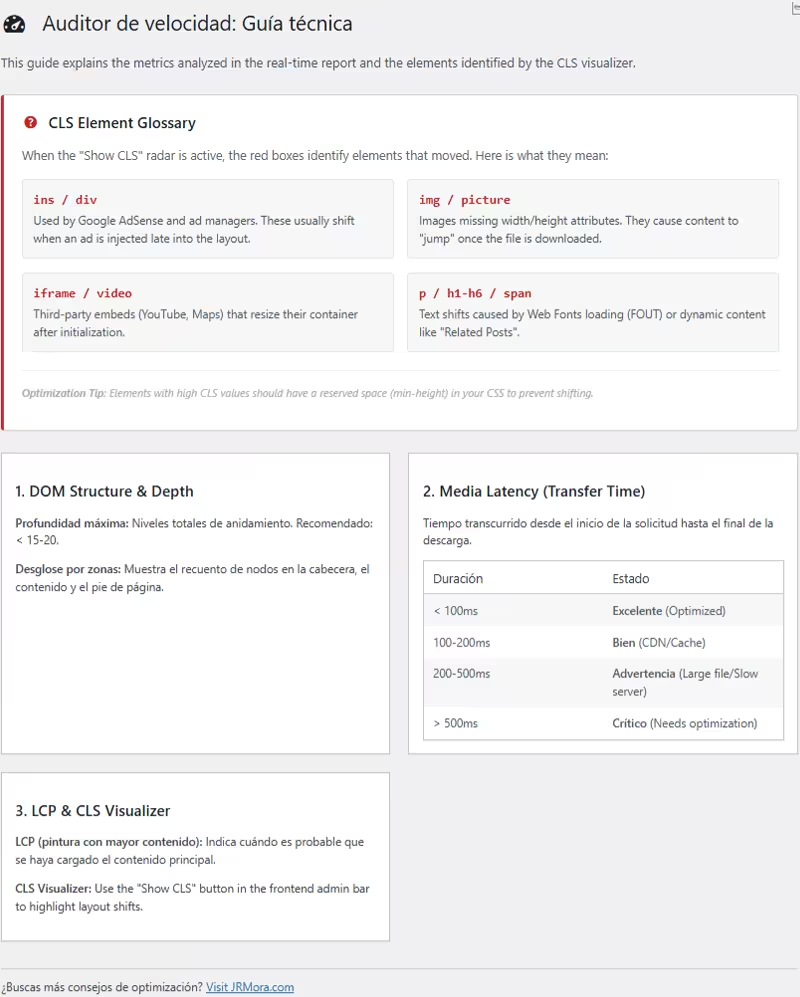
- DOM depth analysis: Crucial to avoid "DOM size excessive". Speed Auditor breaks down the number of nodes by zones (Header, Content, Footer) and warns you if nesting exceeds 15-20 levels.
- Media Latency Monitor: Measures the actual transfer time (Resource Timing API) of images. If an image takes 500ms to download, the plugin marks it as critical.
- Zero impact on the server: All processing occurs on the client (browser) side. There are no heavy database queries or PHP processes that slow down the site.
The big leap. Coming soon: Speed Auditor 1.1.9 (with "Radar CLS")
Until now, Cumulative Layout Shift (CLS) was an abstract figure in a report. You knew something was moving, but you didn't always know what. Very soon, in version 1.1.9, this will change.
The radar or Visual CLS "Highlighter" button shall be introduced.

Imagine activating a "radar" mode that draws red boxes over any element that moves while you scroll. This, which some extensions already do, with more or less success, is always a very useful visual aid to try to catch those "overflows" that sometimes escape the eye.
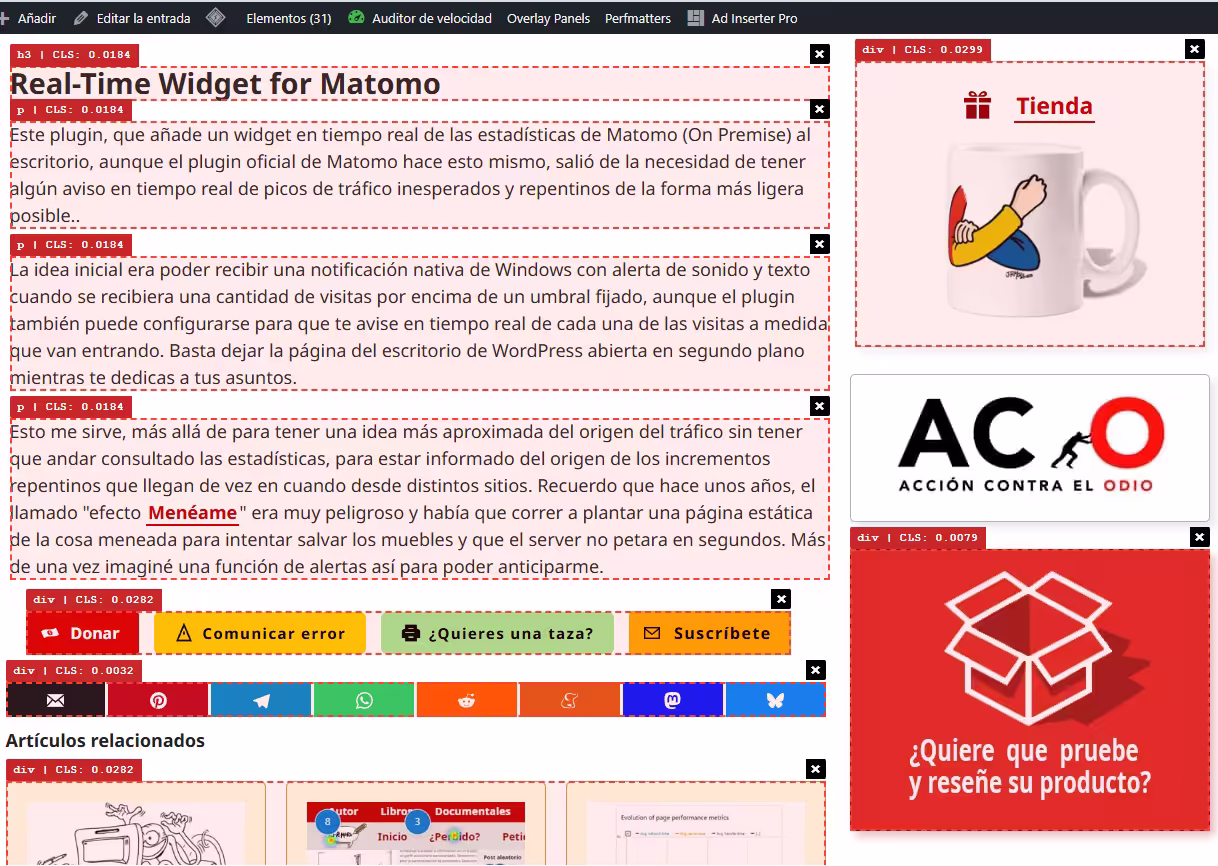
- Is it an AdSense banner pushing your content? You'll see it with a red box. You can go deeper into this problem here.
- Is it an image without defined dimensions? The radar will catch it.
- Total persistence: You will be able to browse your entire website with the radar on; the plugin will remember that you want to keep visually auditing every corner.
This update will also include a short technical glossary, which will be expanded to include tips and tutorials, which will be integrated into your WordPress dashboard, so that terms like ins, iframe or figure will no longer be a mystery.
The idea is to improve both the response of the analysis and the reports generated as I test it in different scenarios and if I receive any suggestions for improvement or warnings of errors.
Version 1.1.8 is now available to tidy up your metrics, and soon, 1.1.9 will make it even easier to fix the visual stability of WordPress. If you install it now, you will receive the update shortly.
How does it work?
The code follows these three steps:
1. The PerformanceObserver
The browser (Chrome, Edge, Opera) has a native API called Performance API. The plugin registers a "watcher" called PerformanceObserver specifically configured for the layout-shift input type.
Every time something moves on the screen after it has been initially painted, the browser generates an event. The plugin traps that event and extracts two key pieces of data:
- The value of the offset: (That number as 0.0145).
- The culprit element: The browser tells the plugin exactly which HTML node was moved.
2. The "Recent Interaction" filter
This is where the plugin tries to be clever. Not all moves are "bad". If you click on a drop-down menu and the content scrolls down, that is an expected move by the user.
The plugin checks a property called hadRecentInput. If you have touched a key or clicked in the last 500ms, the browser marks that movement as "expected" and the plugin ignores it to avoid false positives. It only detects movements that occur unexpectedly (such as an ad appearing suddenly).
3. Visual rendering (The red boxes)
Once the plugin has the element that has been moved, the visual part comes into play:
- Coordinate calculation: Uses a function called getBoundingClientRect() to find out where that element is on the screen at that precise moment (pixel up, pixel left).
- Frame injection: Create a
divwith absolute position, a 2px red border and a very highz-indexto draw on top of everything. - The label: Add a small box at the top left of the red box with the name of the label (ins, img, div) and the value of the accumulated CLS.
Why is this better than an external report?
Tools such as PageSpeed sometimes fail to detect CLS because they do not scroll to the bottom or do not wait for certain ads to load.
The plugin, by using persistence, measures the CLS accumulated throughout the actual user's browsing session. If an element moves a little at the beginning and a little when scrolling, the plugin adds it up and highlights it, giving you the most approximate real figure that Google will end up seeing in its"Chrome User Experience" (CrUX) report.


